
- Title
-
ADAM12-deficient zebrafish exhibit retardation in body growth at the juvenile stage without developmental defects
- Authors
- Tokumasu, Y., Iida, A., Wang, Z., Ansai, S., Kinoshita, M., Sehara-Fujisawa, A.
- Source
- Full text @ Dev. Growth Diff.
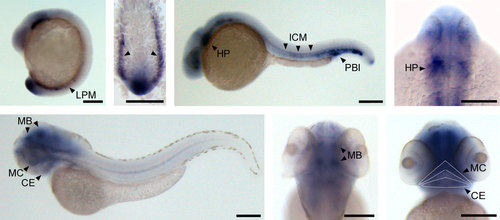
Whole-mount in situ hybridization of zebrafish adam12. Micrographs of adam12 expression in zebrafish embryos, as determined by whole mount in situ hybridization at 16-hpf (A), 24-hpf (B), and 3-dpf (C). A′ shows a dorsal view of the posterior LPM; B′ shows a dorsal view of the heart primordium; C′ shows a dorsal view of the cephalic nerve; and C′′ shows a ventral view of the lower jaw. CE, ceratohyal; HP, heart primordium; ICM, intermediate cell mass; LPM, lateral plate mesoderm; MB, midbrain; MC, Meckel′s cartilage; PBI, posterior blood island. Scale bar: 200 µm. EXPRESSION / LABELING:
|
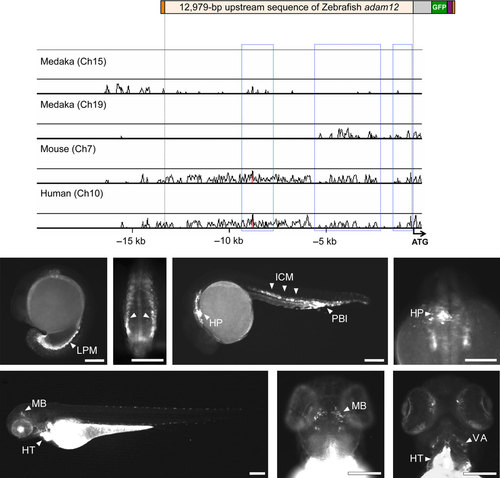
Generation of adam12:EGFP transgenic zebrafish. (A) The colored box is the DNA construction for generation of the adam12:EGFP transgenic zebrafish. A 12 979-bp upstream region of adam12 is connected to egfp (green) across an intron (gray). A SV40-polyA sequence (purple) is added to the tail of the EGFP. The adam12:EGFP cassette is carried by the Tol2 terminal sequences (orange). The waveforms indicate the comparison of the 12 979-bp with corresponding region of medaka, mouse and human. The 12 979-bp contains the conserved region that presumed to the regulatory elements for ADAM12 gene (blue dashed-squares). (B-D) Micrographs of fluorescence imaging of the adam12:EGFP transgenic zebrafish at 16-hpf (B), 24-hpf (C), and 3-dpf (D). B′ shows a dorsal view of the posterior LPM; C′ shows a dorsal view of the heart primordium; D′ shows a dorsal view of the cephalic nerve; and D′′ shows a ventral view of the heart. HP, heart primordium; HT, heart; ICM, intermediate cell mass; LPM, lateral plate mesoderm; MB, midbrain; PBI, posterior blood island; VA, ventral aorta. Scale bar: 200 µm. EXPRESSION / LABELING:
|
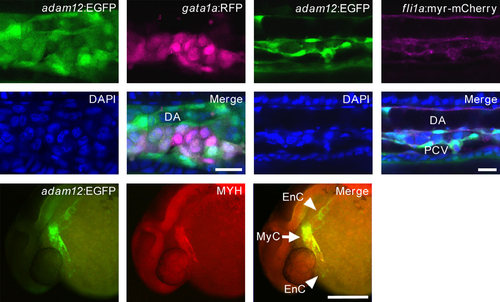
Identification of adam12-EGFP positive cells. (A, B) Confocal micrographs of the ICM region of double transgenic Tg[adam12:EGFP/gata1a:mRFP] or Tg[adam12:EGFP/fli1a:myr-mCherry] embryos. (A) Primitive erythroblasts expressing RFP at 24 hpf. (B) Endothelial cells expressing mCherry at 30-hpf. Nuclei are labeled with DAPI. DA, dorsal aorta; PCV, posterior cardinal vein. Scale bar: 20 µm. (C) MYH expression as determined by immunocytochemistry. MyC, myocardium; EnC, endocardium. Scale bar: 200 µm. |
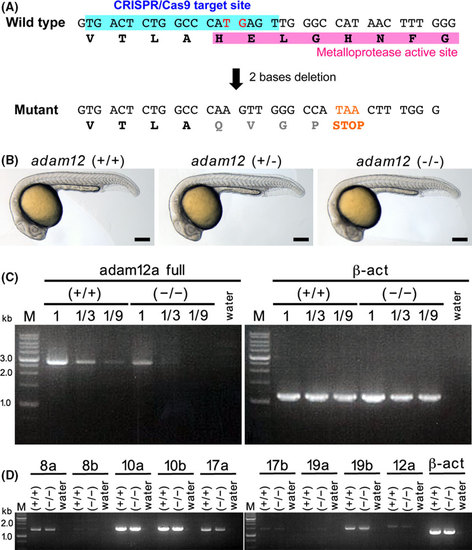
Generation of adam12-KO zebrafish. (A) adam12 gene sequence targeted for deletion and genotype of adam12-KO zebrafish. An alternative stop codon was inserted immediately after the metalloprotease active site as a result of a two-nucleotide (TG) deletion. (B) Whole-body images and genotypic ratio at 24-hpf of F1 embryos obtained by intercrossing adam12 (+/-) fish. Scale bar: 200 µm. (C) Comparison of adam12 mRNA expression levels by semi-quantitative RT-PCR between adam12 (+/+) and (-/-) zebrafish. Primers were designed to amplify the full-length coding sequence of adam12. Total RNA samples were isolated from 24-hpf embryos. Reverse-transcribed cDNA samples at the original concentration and 1/3 and 1/9 dilutions were used as PCR template. Expression of the β-actin gene was used as a positive control. (D) Comparison of adam8a, 8b, 10a, 10b, 17a, 17b, 19a, and 19b expression levels between adam12 (+/+) and (-/-). Primers were designed to amplify partial sequences of each adam gene. |
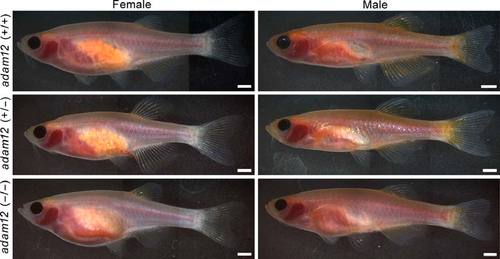
Morphology of the adam12-depleted fish. The pictures indicated the whole-body images of the adam12 (+/+), (+/-) and (-/-) fish at the 4-months. No apparent defects are found in each genotype. The female fish possess unfertilized eggs in their bodies. Scale bar: 2 mm. PHENOTYPE:
|
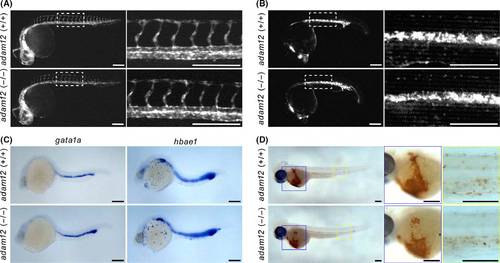
Phenotypic analysis of the blood vessel formation and hematopoiesis. (A) Vascular tube formation and intersegmental vessel (ISV) elongation in fli1a: GFP embryos. DA, dorsal aorta; PCV, posterior cardinal vein at 30-hpf. (B, C) Generation of primitive erythroblasts as visualized by gata1a:mRFP expression (B) and in situ hybridization (C) at 26 hpf. (D) Mature erythrocytes in embryos stained with o-dianisidine at 3-dpf. Scale bar: 200 µm. PHENOTYPE:
|
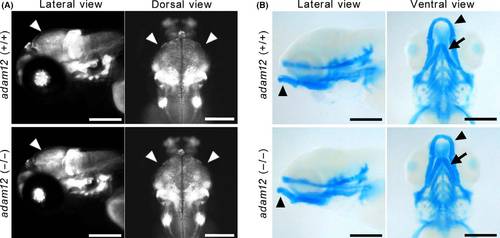
Phenotypic analysis of the cephalic nerve and jaw cartilage. (A) Cephalic nerve, including telencephalon and midbrain (arrowheads), as visualized by neurod: EGFP expression. (B) Alcian Blue staining of jaw cartilage, including Meckel′s cartilage (arrowheads) and ceratohyal (arrows) at 5-dpf. Scale bar: 200 µm. PHENOTYPE:
|
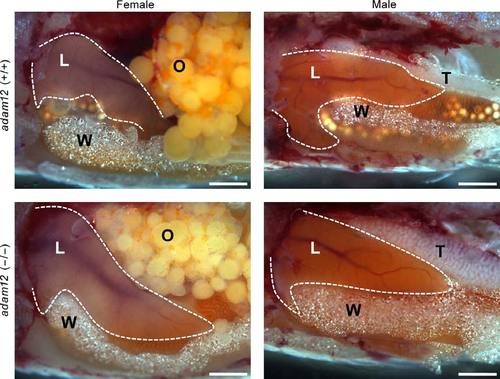
Phenotypic analysis of the internal organs morphologies. The pictures indicated the typical morphologies of the internal organs of the adam12 (+/+) and (-/-) fish at the 4-months. No distinct differences were found in each genotype or sex. L: liver, W: white adipose tissue, O: ovary, T: testis. Scale bars: 1 mm. PHENOTYPE:
|

ZFIN is incorporating published figure images and captions as part of an ongoing project. Figures from some publications have not yet been curated, or are not available for display because of copyright restrictions. PHENOTYPE:
|