
- Title
-
Using Light Sheet Fluorescence Microscopy to Image Zebrafish Eye Development
- Authors
- Icha, J., Schmied, C., Sidhaye, J., Tomancak, P., Preibisch, S., Norden, C.
- Source
- Full text @ J. Vis. Exp.
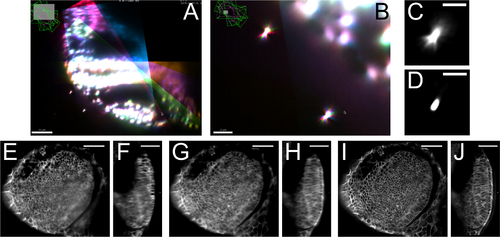
Results of the multiview reconstruction. (A) Overlaid registered views, each in a different color to demonstrate the overlap between them. (B) Magnified view showing the overlap of the PSFs of beads imaged from the different views. (C) Close up of a bead after fusion, the PSF is an average of the different views. (D) PSF of the same bead as in (C) after multiview deconvolution showing that the PSF collapses into a single point. (E) x-y section and (F) y-z section of a single view of an optic vesicle, in which membranes are labeled with GFP showing degradation of the signal in z deeper in the tissue. (G) x-y section and (H) y-z section of the same view after weighted-average fusion of 4 views approximately 20 degrees apart with slightly more degraded x-y resolution overall but increased z-resolution. (I) x-y section and (J) y-z section of the same data after multiview deconvolution, showing a significant increase in resolution and contrast of the signal both in xy and in z. Images in (E-J) are single optical slices. Scale bar represents 50 µm (A, B, E-J) and 10 µm (C, D). |
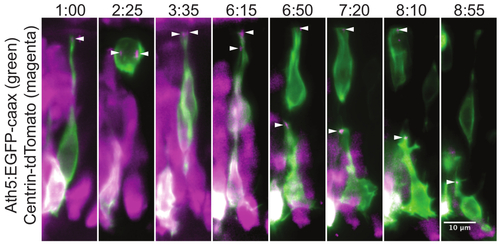
Centrosome localization during the retinal ganglion cell translocation. This montage of a time-lapse experiment shows the position of the centrosome throughout the retinal ganglion cell (RGC) maturation. In the neuronal progenitors the centrosome is localized in the very tip of the apical process (1:00). During cell division, the two centrosomes serve as poles for the mitotic spindle (2:25). This division results in one daughter cell that differentiates into an RGC and a second daughter cell that becomes a photoreceptor cell precursor. After division, the cell body of the RGC translocates to the basal side of the retina, while the apical process remains attached at the apical side. Once the RGC reaches the basal side, its apical process detaches and the centrosome travels with it (6:15). The centrosome can be followed while gradually retracting together with the apical process (6:50, 7:20, 8:10). In the last frame (8:55) the ganglion cell is growing an axon from its basal side, while the centrosome is still localized apically. The mosaic expression was achieved by plasmid DNA injection into wild type embryo at one cell stage. The cells are visualized by the Ath5:GFP-caax (green) construct, which labels RGCs and other neurons. The centrosomes (arrowheads) are labeled by Centrin-tdTomato29 expression (magenta). The apical side of the retina is at the top of the image and the basal side at the bottom. The maximum intensity projection of a 30 µm thick volume is shown. The images were cropped from a movie covering the whole retina. The movie starts at around 34 hr post fertilization (hpf). A z stack was acquired every 5 min with the 40X/1.0 W objective. Time is shown in hh:mm. Scale bar represents 10 µm. |

Translocation of a single retinal ganglion cell. The RGC translocation from apical to basal side of the retina occurs after the terminal mitosis as described in Figure 3. The RGC is labeled by expression of the Ath5:gap-GFP37 transgene. The maximum intensity projection of a 30 µm thick volume is shown. The images were cropped from a movie covering the whole retina. The movie starts at around 34 hpf. A z stack was acquired every 5 min with the 40X/1.0 W objective. Time is shown in hh:mm. Scale bar represents 5 µm. |

Comparison of image quality between single view and two methods of multiview fusion. (A) One optical slice of single view data shown from lateral view and (B) dorsal view. Stripe artifacts and degradation of the signal deeper inside the sample are apparent. Also a part of the image visible in the fused data (C-F) was not captured in this particular view. (C) The same optical slice, now as multiview fused data shown from lateral view and (D) dorsal view. Note that stripe artifacts are suppressed and structures deep in the sample are better resolved. (E) The same optical slice now as multiview deconvolved data shown from lateral view and (F) dorsal view. Note the increased contrast and resolution so the individual cell membranes and nuclei can be well distinguished. The resolution does not deteriorate notably deeper inside the sample. The dataset was acquired with dual sided illumination from 5 views approximately 20 degrees apart. The z stacks of about 100 µm with 1.5 µm step size were acquired at each view in 10 min intervals for 10 hours with the 20X/1.0 W objective. Input images for the multiview fusion and deconvolution were down sampled 2× to speed up the image processing. 15 iterations of the multiview deconvolution were run. (G) The montage shows a cropped area of the dorsal view from the deconvolved data to highlight the morphogenetic events during early eye development from the optic vesicle to the optic cup stage. The two layers of the optic vesicle, which are initially similar columnar epithelia, differentiate into distinct cell populations. The distal layer close to the epidermis becomes the retinal neuroepithelium (RN) and the proximal layer close to the neural tube becomes the retinal pigment epithelium (RP). The cells in the RN elongate and invaginate to form the optic cup (1:40 to 5:00); at the same time the RP cells flatten. The surface ectoderm is induced to form a lens (1:40), which invaginates later (5:00). The movie starts at 17 hpf. Time is shown in hh:mm. All the cellular membranes are labeled by the β-actin:ras-GFP transgene and all the nuclei are labeled by the hsp70:H2B-RFP transgene. Scale bar represents 30 µm. FB forebrain, LE lens, OP olfactory placode, RN retinal neuroepithelium, RP retinal pigment pithelium. |