
|
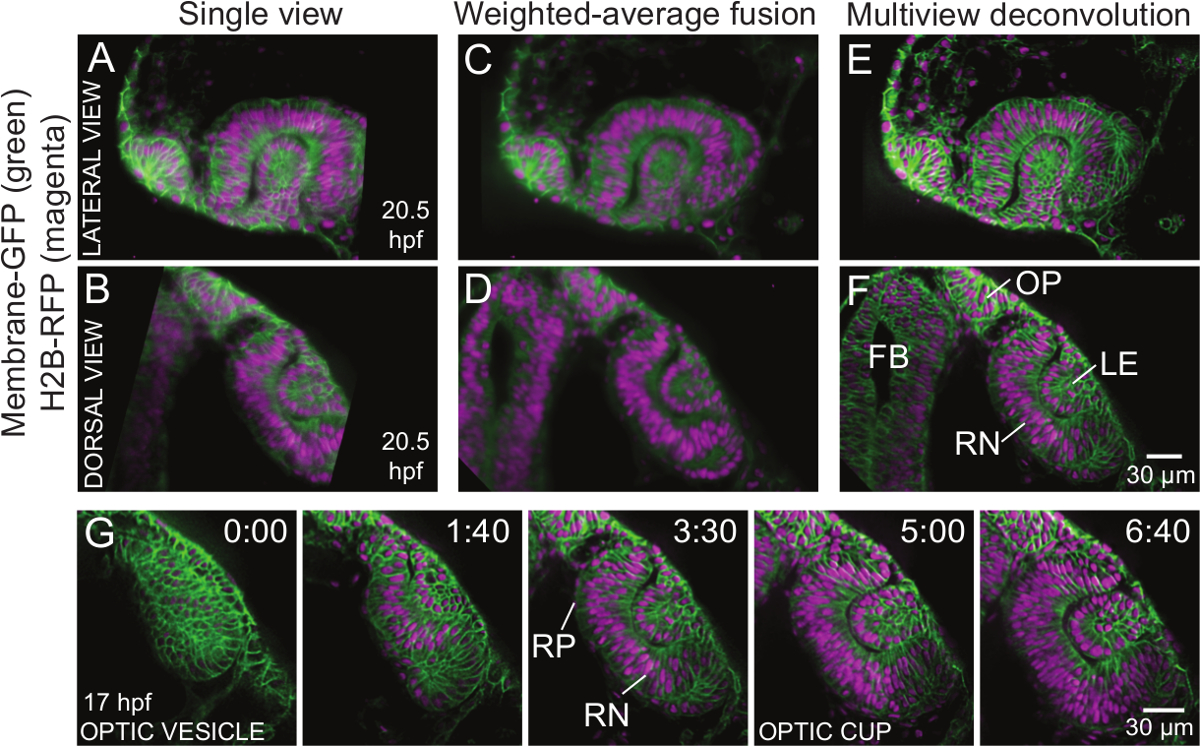
Fig. 5
Comparison of image quality between single view and two methods of multiview fusion. (A) One optical slice of single view data shown from lateral view and (B) dorsal view. Stripe artifacts and degradation of the signal deeper inside the sample are apparent. Also a part of the image visible in the fused data (C-F) was not captured in this particular view. (C) The same optical slice, now as multiview fused data shown from lateral view and (D) dorsal view. Note that stripe artifacts are suppressed and structures deep in the sample are better resolved. (E) The same optical slice now as multiview deconvolved data shown from lateral view and (F) dorsal view. Note the increased contrast and resolution so the individual cell membranes and nuclei can be well distinguished. The resolution does not deteriorate notably deeper inside the sample. The dataset was acquired with dual sided illumination from 5 views approximately 20 degrees apart. The z stacks of about 100 µm with 1.5 µm step size were acquired at each view in 10 min intervals for 10 hours with the 20X/1.0 W objective. Input images for the multiview fusion and deconvolution were down sampled 2× to speed up the image processing. 15 iterations of the multiview deconvolution were run. (G) The montage shows a cropped area of the dorsal view from the deconvolved data to highlight the morphogenetic events during early eye development from the optic vesicle to the optic cup stage. The two layers of the optic vesicle, which are initially similar columnar epithelia, differentiate into distinct cell populations. The distal layer close to the epidermis becomes the retinal neuroepithelium (RN) and the proximal layer close to the neural tube becomes the retinal pigment epithelium (RP). The cells in the RN elongate and invaginate to form the optic cup (1:40 to 5:00); at the same time the RP cells flatten. The surface ectoderm is induced to form a lens (1:40), which invaginates later (5:00). The movie starts at 17 hpf. Time is shown in hh:mm. All the cellular membranes are labeled by the β-actin:ras-GFP transgene and all the nuclei are labeled by the hsp70:H2B-RFP transgene. Scale bar represents 30 µm. FB forebrain, LE lens, OP olfactory placode, RN retinal neuroepithelium, RP retinal pigment pithelium.