
- Title
-
Fine-Tuning of Pten Localization and Phosphatase Activity Is Essential for Zebrafish Angiogenesis
- Authors
- Stumpf, M., Blokzijl-Franke, S., den Hertog, J.
- Source
- Full text @ PLoS One
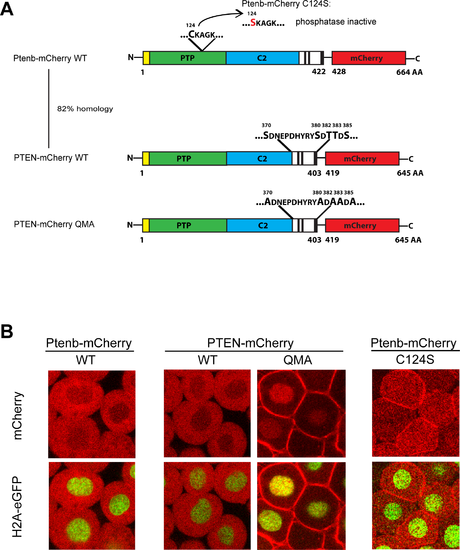
PTEN QMA localizes to the cell membrane and nucleus in zebrafish embryos. (A) Wild type Ptenb (long splicing variant, 422 amino acids) and human PTEN share a homology of 82%, both consisting of an N-Terminus (yellow), the PTP-domain (green), the C2 domain (blue) and the C-terminus (black and white). Mutation of the catalytic cysteine 124 to serine, C124S, results in catalytically inactive Ptenb. PTEN QMA contains five point mutations in its C-terminal phosphorylation sites, resulting in an open conformation of PTEN [19]. The red fluorescent protein mCherry (red) is C-terminally tagged in frame to all constructs used in these experiments. (B) Subcellular localization of Ptenb-mCherry, PTEN-mCherry, PTEN-mCherry QMA and Ptenb-mCherry C124S was assessed in tg(H2A-eGFP) zebrafish embryos, microinjected with 300pg synthetic mRNA at the one-cell stage and submitted to confocal live imaging at 6hpf. Top panels: mCherry expression; bottom panels: overlay of mCherry expression with H2A-GFP, which localizes to the nucleus. |
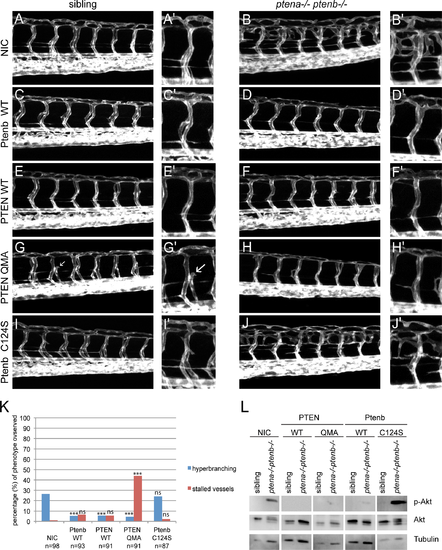
Ptenb, PTEN and PTEN QMA, but not Ptenb C124S rescued the hyperbranching vasculature phenotype. (A-J) Zebrafish embryos from a tg(kdrl:eGFP) ptena+/- ptenb-/- incross were microinjected at the one-cell stage with 300 pg synthetic mRNA encoding wild type PTEN-mCherry, PTEN-mCherry QMA, Ptenb-mCherry WT or Ptenb-mCherry C124S. At 3dpf the embryos were analyzed for the hyperbranching vessel phenotype by confocal live- imaging on a Leica TCS-SPE microscope (anterior to the left, 20x objective, 2μm z-stacks). Pictures show the trunk region distal from the urogenital opening of representative, genotyped embryos. Non-injected control embryos (control) were included for reference. (A’-J’) A close-up is added on the right side of each image. (G) Remarkably, we found a second phenotype in the PTEN-mCherry QMA injected embryos, consisting of a significantly increased number of lacking or stalled intersegmental vessels (indicated with white arrows). (K) Quantification of the embryos showing the typical ptena-/-ptenb-/- hyperbranching vessel phenotype at 3 dpf (blue bars). In the non-injected control (NIC), approximately 25% of the embryos showed the characteristic phenotype (Mendelian segregation). The percentage of embryos showing the stalled vessel phenotype at 3dpf is also indicated (red bars). The statistical significance of each of the conditions compared to the non-injected control was determined using two-tailed Fisher’s exact test and is indicated in the bar graph (ns = not significant, * = p-value < 0.05, ** = p-value < 0.01, *** = p-value < 0.001). (L) Embryos from a ptena+/-ptenb-/- incross were microinjected at the one-cell stage with wild type PTEN, PTEN QMA, wild type Ptenb or Ptenb C124S. At 4dpf, single embryos were cut in half. The trunk region was used for genotyping and the anterior half was lysed and processed for immunoblotting. Lysates from siblings and ptena-/-ptenb-/- embryos were run side by side on gels and blotted. The membranes were probed with phosphospecific anti-pAkt antibody (directed against pSer473), stripped and probed with Akt-specific antibody, stripped and probed with a Tubulin-specific antibody as a loading control. Representative blots are shown. |

Mutation of Pten K13 alters Pten subcellular localization in 6hpf zebrafish embryos. (A) Point mutations were introduced into the N-terminus of Ptenb (long splicing variant, 422 amino acids) via site-directed mutagenesis. K13 was replaced by either arginine (K13R, charge conserving), alanine (K13A, change to neutral charge) or glutamate (K13E, charge inverting) to address the importance of lysine 13 for the subcellular localization of Pten. The red fluorescent protein mCherry (red) is C-terminally tagged in frame to all constructs used in these experiments. (B) Subcellular localization of Ptenb-mCherry K13R, K13A and K13E was assessed in tg(H2A-eGFP) zebrafish embryos, microinjected with 300pg synthetic mRNA and submitted to confocal live imaging at 6hpf. Top panels: mCherry expression; bottom panels: overlay of mCherry expression with H2A-GFP, which localizes to the nucleus. |

Enhanced membrane accumulation of phosphatase-active Pten induces stalled intersegmental vessels. (A-J) Zebrafish embryos from a tg(kdrl:eGFP) ptena+/-ptenb-/- incross were microinjected at the one-cell stage with 300 pg synthetic mRNA encoding either Ptenb-mCherry WT, K13R, K13A or K13E. At 3dpf the embryos were analyzed for the hyperbranching vessel phenotype by confocal live imaging on a Leica TCS-SPE microscope (anterior to the left, 20x objective, 2μm z-stacks). Pictures show the trunk region distal from the urogenital opening of representative, genotyped embryos. Non-injected control embryos (NIC) were included for reference. (A’-J’) A close-up is added on the right side of each image. Stalled vessels are indicated with white arrows. (K) Quantification of the embryos expressing the indicated Ptenb mutants, showing the typical ptena-/-ptenb-/- hyperbranching vessel phenotype (blue bars) or the stalled vessel phenotype (red bars) at 3dpf. In the non-injected control (NIC), approximately 25% of the embryos showed the characteristic hyperbranching phenotype (Mendelian segregation). The statistical significance of each of the conditions compared to the non-injected control was determined using two-tailed Fisher’s exact test and is indicated in the bar graph (ns = not significant, * = p-value < 0.05, ** = p-value < 0.01, *** = p-value < 0.001). (L) Embryos from a ptena+/-ptenb-/- incross were microinjected at the one-cell stage with wild type Ptenb or Ptenb K13 mutants as indicated. At 4dpf, single embryos were cut in half. The trunk region was used for genotyping and the anterior half was lysed and processed for immunoblotting. Lysates from siblings and ptena-/-ptenb-/- embryos were run side by side on gels and blotted. The membranes were probed with phosphospecific anti-pAkt antibody (directed against pSer473), stripped and probed with Akt-specific antibody, stripped and probed with Tubulin-specific antibody as a loading control. Representative blots are shown. |
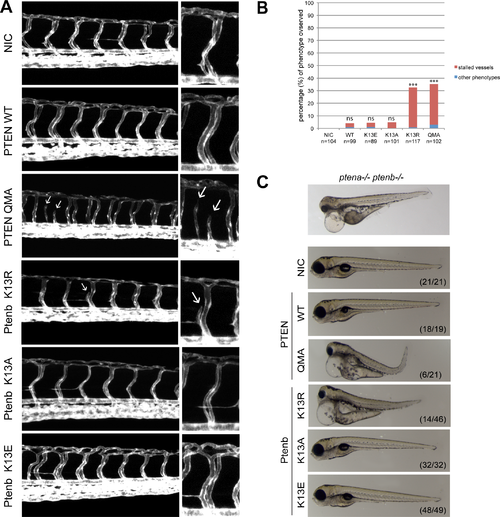
Ptenb K13R and PTEN QMA induce stalled vessels and developmental defects in wild type embryos. (A) Tg(kdrl:eGFP) zebrafish embryos were microinjected at the one-cell stage with 300 pg synthetic mRNA encoding either PTEN-mCherrry WT, PTEN-mCherry QMA, Ptenb-mcherry K13R, Ptenb-mCherry K13A or Ptenb-mCherry K13E. At 3dpf the embryos were analyzed for the hyperbranching or stalled vessel phenotype by confocal live- imaging using a Leica TCS-SPE microscope (anterior to the left, 20x objective, 2μm z-stacks). Pictures show the trunk region distal to the urogenital opening of representative embryos; non-injected control embryos (NIC) were included for reference. Stalled vessels are indicated with white arrows. (B) Quantification of the number of embryos showing either stalled intersegmental vessels (red bars) or other phenotypes, such as hyperbranching (blue bars) (percentage of total number of embryos). The statistical significance was determined using two-tailed Fisher’s Exact test. (ns = not significant, * = p-value < 0.05, ** = p-value < 0.01, *** = p-value < 0.001). (C) At 4dpf, brightfield images of single embryos were taken to assess gross morphological defects in response to expression of PTEN, Ptenb or mutants. A picture of a mutant ptena-/-ptenb-/- embryo (top panel) is provided as a reference. Note the massive edemas, short body axis and craniofacial abnormalities in the ptena-/-ptenb-/- embryo as well as the embryos expressing PTEN QMA and Ptenb K13R. The numbers in the bottom right corner represent the number of embryos showing the depicted phenotype/ total number of embryos. |