
- Title
-
Discovery and characterization of Isofistularin-3, a marine brominated alkaloid, as a new DNA demethylating agent inducing cell cycle arrest and sensitization to TRAIL in cancer cells
- Authors
- Florean, C., Schnekenburger, M., Lee, J.Y., Kim, K.R., Mazumder, A., Song, S., Kim, J.M., Grandjenette, C., Kim, J.G., Yoon, A.Y., Dicato, M., Kim, K.W., Christov, C., Han, B.W., Proksch, P., Diederich, M.
- Source
- Full text @ Oncotarget
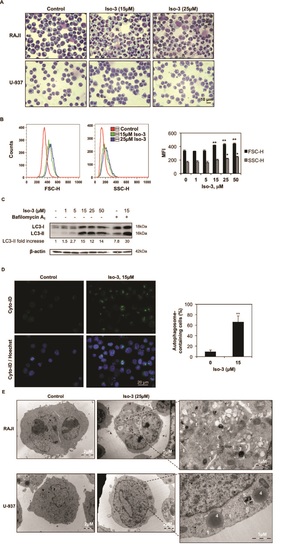
Iso-3 induces autophagy in lymphoma cells. (A) Morphological analysis was performed by Diff-Quik staining and microscopic observation of RAJI and U-937 cells after 24 h of treatment with Iso-3. (B) Cellular size (forward scatter, FSC) and granularity (side scatter, SSC) were measured by flow cytometry in RAJI cells treated for 24 h with Iso-3. (C) Western blot analysis of LC3 conversion in RAJI cells treated with different concentrations of Iso-3 for 24 h. Where indicated, bafilomycin A1 (40 nM) was added 2 h before harvesting. Blots are representative of three independent experiments. (D) RAJI cells where treated or not with Iso-3 for 24 h, then stained with Cyto-ID® Green dye as described in the materials and methods section, and appearance of autophagosome-related vesicles was observed by fluorescence microscopy. Representative images and quantification of autophagosome-positive cells are provided. (E) Representative images of electron microscopy analysis of RAJI and U-937 cells treated or not for 24 h with Iso-3. (1) Phagophores, (2) autolysosomes of different maturity, (3) residual bodies, (4) lysosomes, (5) multivesicular body. All histograms represent the mean ± SD of three independent experiments. All blots are representative of three independent experiments. |
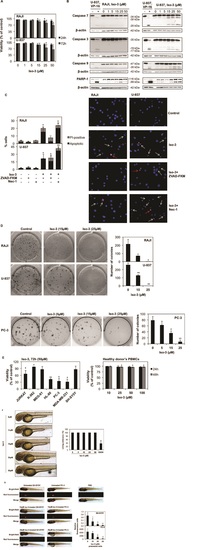
Effect of Iso-3 on cell viability. (A) The viability of RAJI and U-937 cells was measured by trypan blue exclusion assay after 24 and 72 h of exposure to Iso-3. (B) Western blot analyses of caspase activation and PARP-1 cleavage in RAJI and U-937 cells treated for 72 h with Iso-3. U-937 cells, untreated or treated with 100 µM VP-16 for 3 h, were used as negative and positive controls for caspase cleavage, respectively. (C) Hoechst-PI staining of RAJI and U-937 cells treated with 50 µM Iso-3 for 72 hours. Apoptotic and non-apoptotic PI-positive nuclei are reported as a percentage of the total number of cells. ZVAD-FKM (50 µM) and Necrostatin-1 (Nec-1; 30 µM) were added 1 h before Iso-3 treatment, where indicated. White arrows: apoptotic cells. Red arrow: PI-positive cells. Pictures are representative of three independent experiments (D) RAJI, U-937 and PC-3 cells were grown in the presence of Iso-3 for 10 days and colony formation was then scored. (E) Trypan blue scored viability of a panel of cancer cell lines (left) and of PBMCs from healthy donors after Iso-3 treatment at the indicated time points and doses. (F) Representative images of Zebrafish embryos after 24 h treatment with the indicated Iso-3 doses (right panel) and corresponding quantification of viable embryos percentage (left panel). Ethanol 3% (EtOH) was used as a positive control for toxicity. (G) Fluorescent SH-SY5Y or PC-3 cells were treated or not in vitro at different concentrations of Iso-3 for 24 h and then injected in the zebrafish yolk sac. Fluorescence was quantified. Representative images from a total of six to nine fish per condition. Fluorescence intensity quantification graphs are shown. PBS injection was used as a control for injection toxicity. All histograms represent the mean ± SD of three independent experiments. All blots are representative of three independent experiments. |
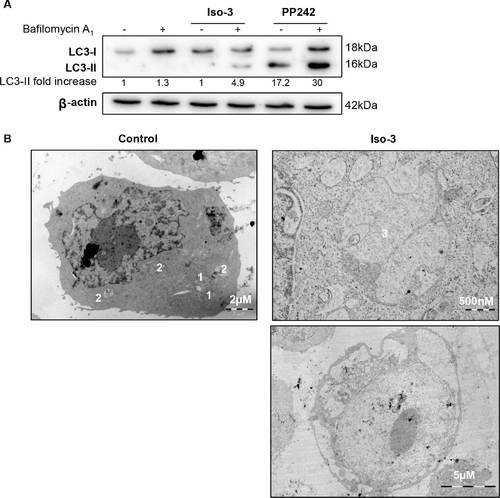
(A) Western blot analysis of LC3 conversion in RAJI cells treated with 15 µM Iso-3 for 12 h. Where indicated, bafilomycin A1 (40 nM) was added 2 h before harvesting. Cells treated 4 h with PP242 (10 µM) were used as a positive control for autophagy induction. Blot is representative of three independent experiments. (B) RAJI control cells exhibit low basal autophagy levels. (1) Lysosomes, (2) autolysosomes. A RAJI cell treated with 15 µM Iso-3 for 24 h shows a large autophagocytic vacuole (upper image); in extreme cases, autophagy induction culminates in autophagic cell death, evidenced by extensive vacuolization, organelle depletion while nucleus is non-pyknotic (lower image). (3) A large autophagocytic vacuole with membrane remnants. |
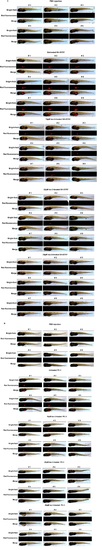
Fluorescent SH-SY5Y (A) or PC-3 (B) cells were treated or not in vitro at different concentrations of Iso-3 for 24 h and then injected into the zebrafish yolk sac. Fluorescence was scored after 72 h. PBS injection was used as a control for injection toxicity. |