
|
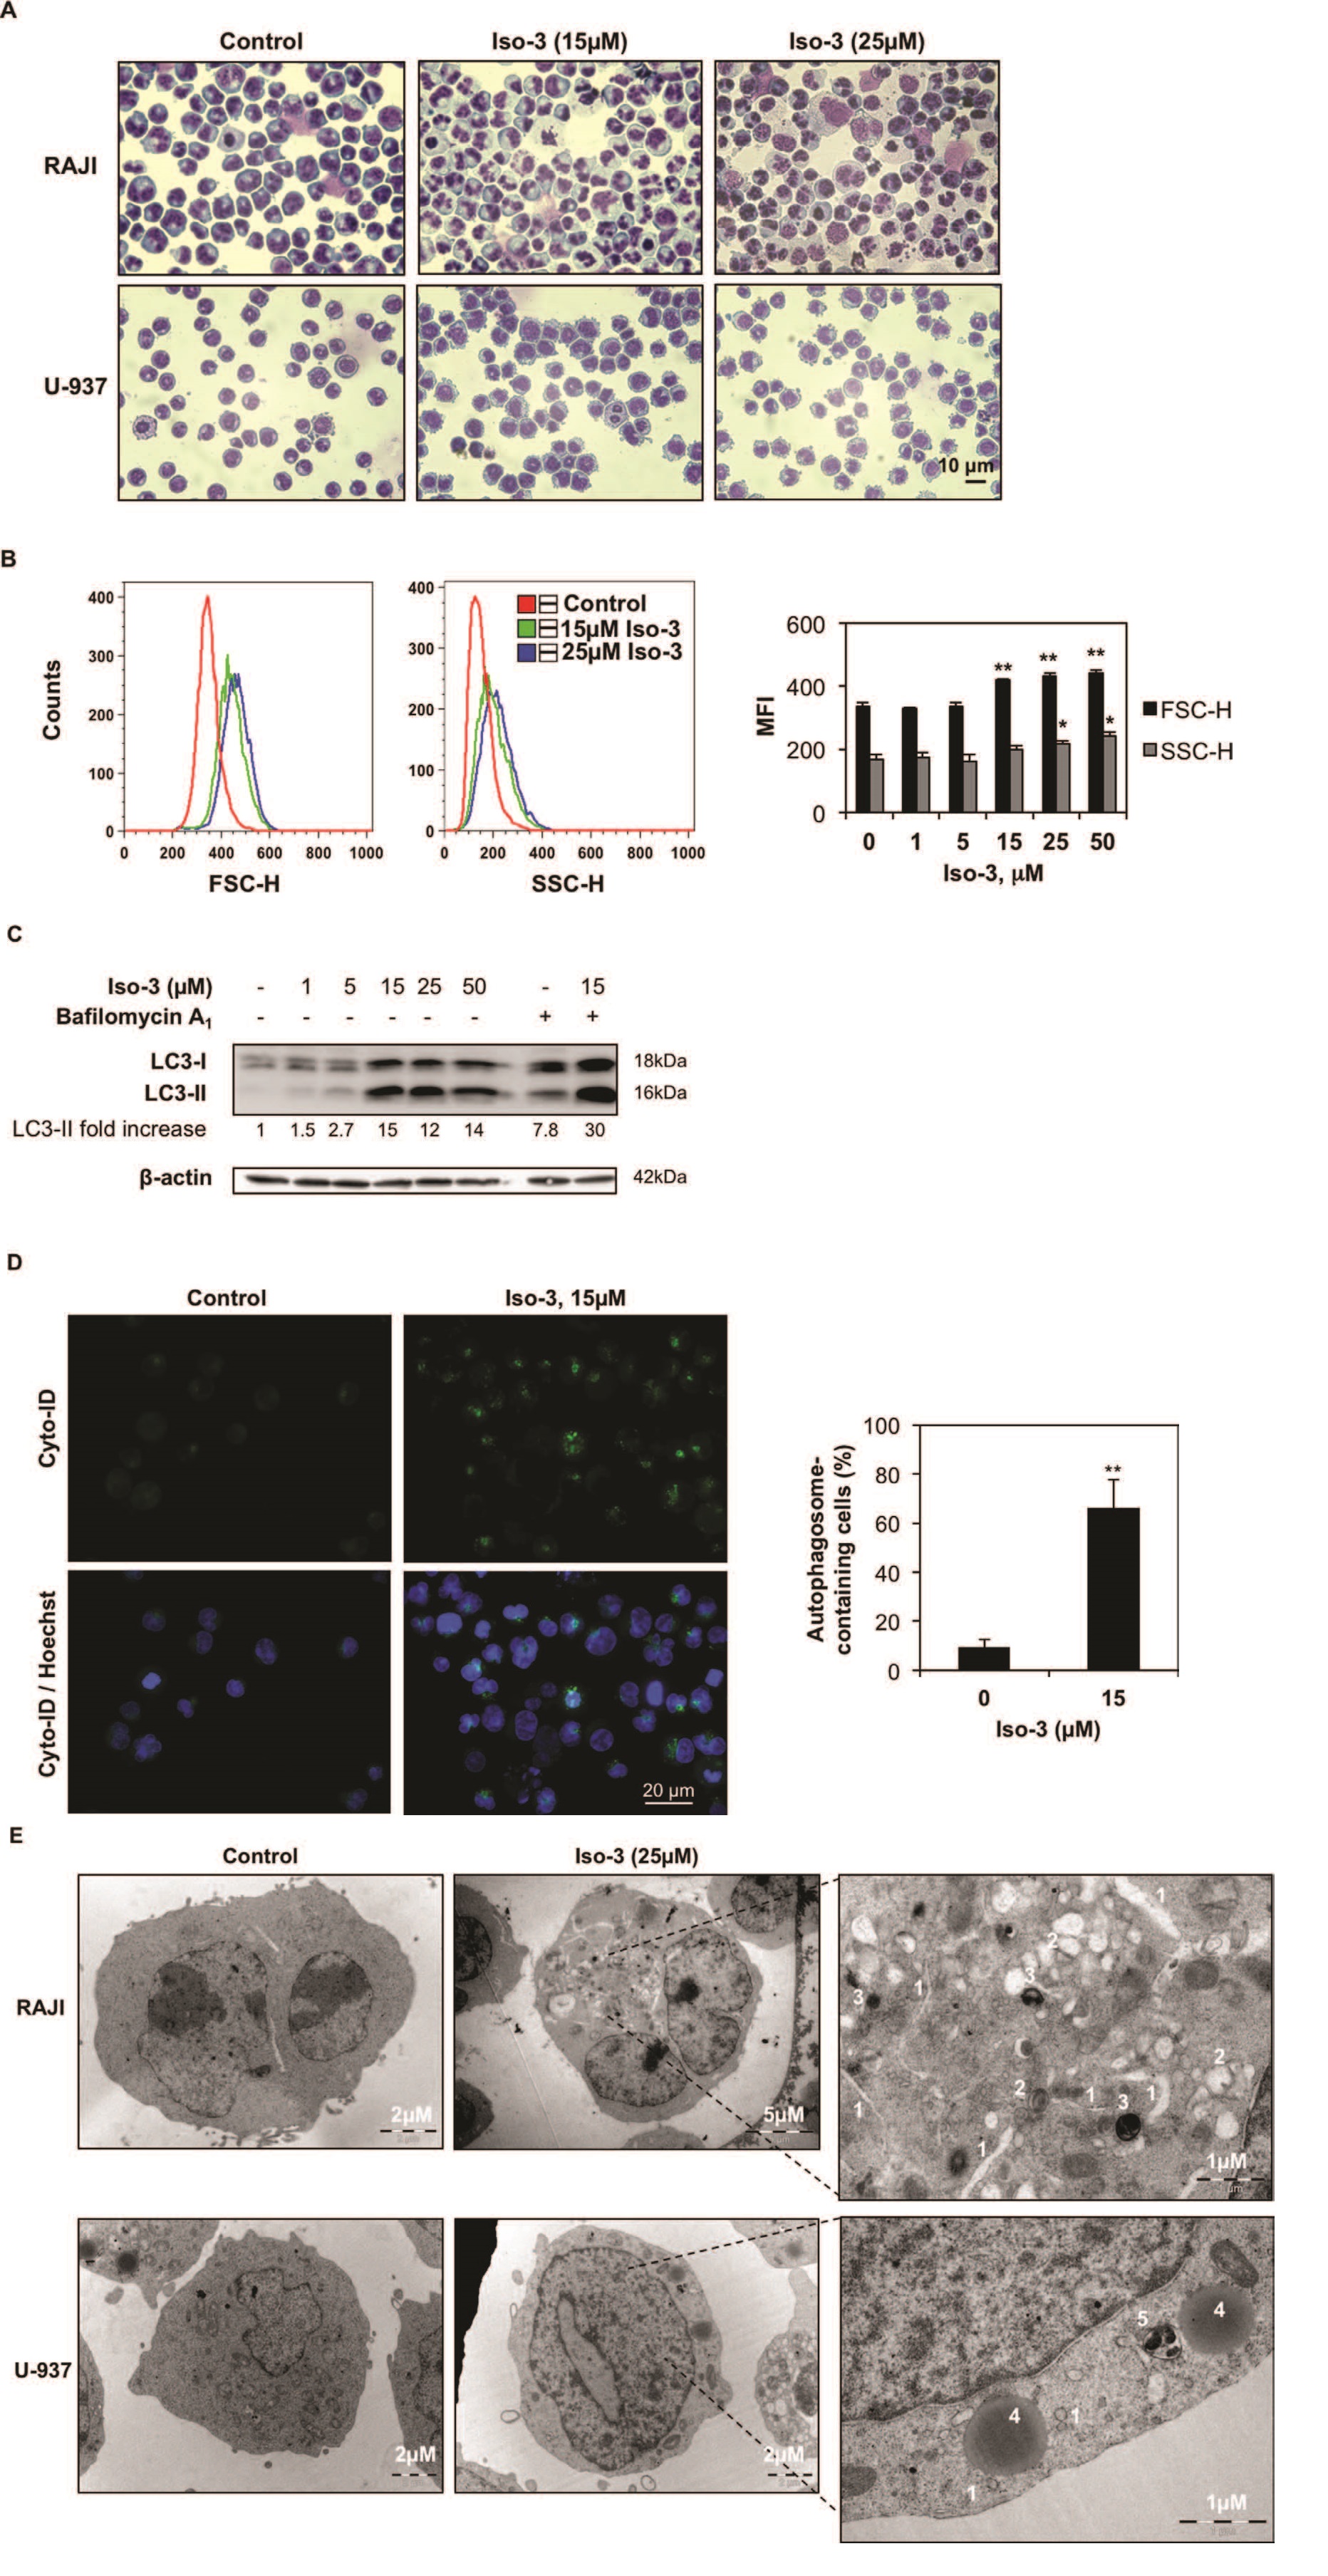
Fig. 4
Iso-3 induces autophagy in lymphoma cells. (A) Morphological analysis was performed by Diff-Quik staining and microscopic observation of RAJI and U-937 cells after 24 h of treatment with Iso-3. (B) Cellular size (forward scatter, FSC) and granularity (side scatter, SSC) were measured by flow cytometry in RAJI cells treated for 24 h with Iso-3. (C) Western blot analysis of LC3 conversion in RAJI cells treated with different concentrations of Iso-3 for 24 h. Where indicated, bafilomycin A1 (40 nM) was added 2 h before harvesting. Blots are representative of three independent experiments. (D) RAJI cells where treated or not with Iso-3 for 24 h, then stained with Cyto-ID® Green dye as described in the materials and methods section, and appearance of autophagosome-related vesicles was observed by fluorescence microscopy. Representative images and quantification of autophagosome-positive cells are provided. (E) Representative images of electron microscopy analysis of RAJI and U-937 cells treated or not for 24 h with Iso-3. (1) Phagophores, (2) autolysosomes of different maturity, (3) residual bodies, (4) lysosomes, (5) multivesicular body. All histograms represent the mean ± SD of three independent experiments. All blots are representative of three independent experiments.