
- Title
-
In Vivo Screening Using Transgenic Zebrafish Embryos Reveals New Effects of HDAC Inhibitors Trichostatin A and Valproic Acid on Organogenesis
- Authors
- Li, L., Bonneton, F., Tohme, M., Bernard, L., Chen, X.Y., Laudet, V.
- Source
- Full text @ PLoS One
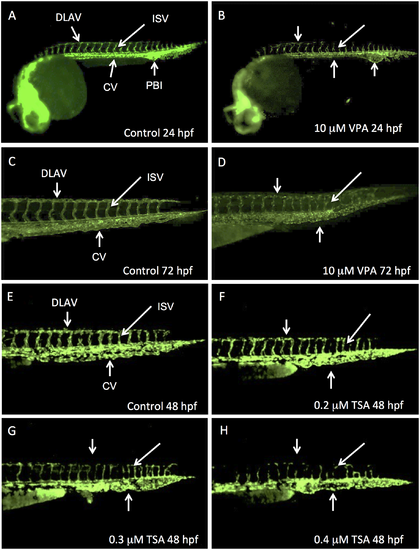
VPA and TSA perturb the development of vascular system. Lateral views of Fli1-EGFP whole embryos at 24 hpf (A, B) or of their caudal part at 48 hpf (E-H) or 72 hpf (C, D). Control embryos at 24 hpf (A), 48 hpf (E) and 72 hpf (C). Embryos treated with VPA 10 μM observed at 24 hpf (B) or 72 hpf (D). 48 hpf embryos treated with increased concentrations of TSA: 0.2 μM (F), 0.3 μM (G) or 0.4 μM (H). DLAV: dorsal longitudinal anastomotic vessel; ISV: intersegmental vessel; CV: caudal vein; PBI: posterior blood island. |
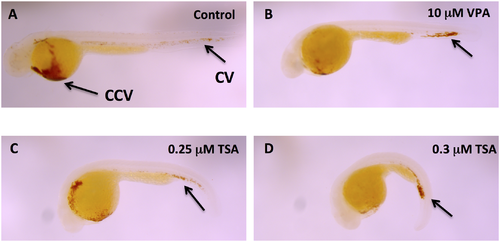
VPA and TSA impair hematopoietic cell migration. Erythrocytes revelation by hemoglobin localization using O-dianisidine staining in 48 hpf embryos. Control embryo (A). Embryos treated with 10 μM VPA (B), 0.25 μM TSA (C), or 0.3 μM TSA (D). CCV: common cardinal vein; CV: caudal vein. |
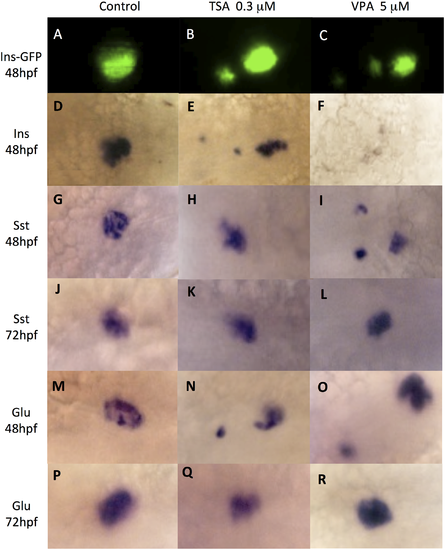
VPA and TSA disrupt cells clustering in endocrine pancreas. Cells of the endocrine pancreas are revealed in control embryos (A, D, G, J, M, P) or embryos treated with 0.3 μM TSA (B, E, H, K, N, Q) or 5 μM VPA (C, F, I, L, O, R). GFP fluorescence in β-cells of 48 hpf embryos of the insulin-GFP transgenic line (A, B, C). Whole-mount in situ hybridizations to detect the transcripts of: insulin in β-cells (D-F); somatostatin in δ-cells at 48hpf (G-I) or 72 hpf (J-L); glucagon in α-cells at 48hpf (M-O) or 72 hpf (P-R). |

VPA and TSA delay the development of exocrine pancreas. The development of exocrine pancreas was analyzed at 72 hpf, 96 hpf and 120 hpf. GFP fluorescence in embryos of the ElastaseA-GFP transgenic line: controls (A-D), embryos treated with 0.2 μM TSA (D-F). White arrows indicate the exocrine pancreas. Whole-mount in situ hybridizations to detect trypsin transcripts (G-X) in differentiated pancreatic exocrine cells of control embryos (G-I), embryos treated with increasing concentrations of TSA (J-R) or VPA (S-X). Black arrows indicate the exocrine pancreas. |

Lipid accumulation in larvae treated with VPA and TSA. Oil Red O staining shows the localization of neutral lipids in 10 dpf larvae that have been on a high fat diet between 6 dpf and 9 dpf. An arrow indicates the liver. Control embryos (a-c), embryos treated with increasing concentrations of TSA (d-u) or VPA (A-L). The red lozenges on the right schematize the lipid accumulation, highlighting the non-monotonic dose response. Note that the maximum accumulation is observed at intermediate concentrations. |
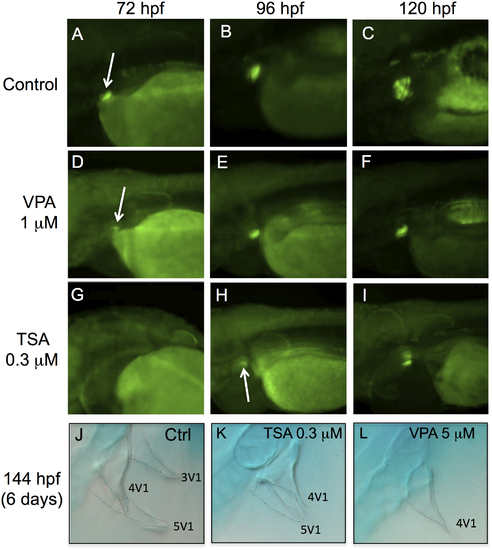
VPA and TSA delay the formation of pharyngeal teeth. The development of pharyngeal teeth was analyzed at 72 hpf, 96 hpf and 120 hpf. GFP fluorescence in embryos of the Dlx2b-EGFP transgenic line: controls (A-C), embryos treated with 1 μM VPA (D-F) or 0.3 μM TSA (G-I). White arrows indicate pharyngeal tooth germs. Alcian blue staining at 144 hpf in control embryos (J) or embryos treated with 0.3 μM of TSA (K) or 5 μM of VPA (L). Dotted lines highlight the contours of three teeth: 3V1, 4V1 and 5V1. |

Developmental effects of diclofenac and TBBPA. Fli1a-EGFP. Untreated 48 hpf embryo (A) and embryo treated with 10 μM diclofenac (B) or 2.5 μM of TBBPA (C). |
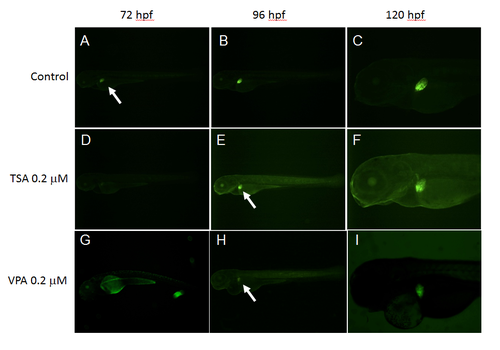
PA and TSA delay liver development. The development of liver was analyzed at 72 hpf, 96 hpf and 120 hpf. GFP fluorescence in embryos of the LFABP-EGFP transgenic line: controls (A-C), embryos treated with 0.2 μM TSA (D-F) or 0.2 μM VPA (G-I). White arrows indicate liver primordia. |