
- Title
-
Short Telomeres in Key Tissues Initiate Local and Systemic Aging in Zebrafish
- Authors
- Carneiro, M.C., Henriques, C.M., Nabais, J., Ferreira, T., Carvalho, T., Ferreira, M.G.
- Source
- Full text @ PLoS Genet.

Different zebrafish tissues have different telomere lengths and follow specific dynamics of shortening with aging. A) Representative images of telomere restriction fragment (TRF) analysis of genomic DNA by Southern Blot (random primer-labelled telomeric probe (TTAGGG)n 32P-dCTP). Aa) WT telomeres are longer in whole larvae (“L”, ca. 12 kb) and shorter in 3 month-old zebrafish gut (G), testis (T) and muscle (M), but show significant variation in length between tissues (shown for two independent WT zebrafish “1” and “2” in Fig 1Aa, except for testis where only zebrafish “1” is shown; densitometry shown for zebrafish “1”, Fig 1Ab). WT have longer telomeres in testis (ca.9.9 Kb), followed by muscle (ca. 9.4 Kb) and, finally, gut (8.4 Kb). These differences are globally maintained in tert-/- tissues (ca. 8.3 Kb in the testis, ca. 8.5 in the muscle and ca. 7.8 Kb in the gut; shown for two 3-month old zebrafish “1” and “2” in Fig 1Aa; densitometry shown for individual “1”, Fig 1Ab). Yellow line indicates median telomere length, mTL, for each tissue sample/lane. B) WT telomeres significantly shorten in the fin and kidney marrow with age, but follow different shortening kinetics with time (black star represents WT larvae telomeres; two zebrafish shown for each age after sexual maturation– 3, 12, 17, 24, 28, 36 months for the fin and 3, 18, 24, 36 months for the kidney marrow). Ba) The telomere shortening rate within the same individual (measured by cutting different fins in different time points) is of 45 bp/month and 90 bp/month for two independent zebrafish (in Fig Ba, lanes 1 and 2 of each time point are the same individual over time between the ages of 3 and 24 months). WT telomeres in the fin match the shorter length of 12-month old tert-/- mutants by 18–24 months (N = 4 for WT and N = 3 for tert-/- fin; red star represents tert-/- larvae telomeres; Fig 1Ba), but WT kidney marrow telomeres never reach tert-/- levels (N = 3–6 per time point for adult WT and N = 3 for adult tert-/- mutants, Fig 1Bb). TRF mean sizes were calculated as previously described [54]. mTL data is represented as mean +/- SEM. |

Telomeres shorten in WT gut and muscle, but not in testis, with aging reaching the length of tert-/- tissues. A-C) Representative images of telomere restriction fragment (TRF) analysis of genomic DNA by Southern Blot (random primer-labelled telomeric probe (TTAGGG)n 32P-dCTP) and quantifications of median telomere length. Black and red stars represent WT and tert-/- larvae telomeres, respectively, in quantifications of median TRF over time. WT telomeres shorten linearly with aging from 3 to 24 months, in A) gut (N = 3–4 per time point) and B) muscle (N = 3–4 per time point), stabilizing in later ages. C) No significant telomere shortening is detected in the testis (N = 5–6 per time point). Around 20 months of age WT telomeres reach the shorter length of 12 month-old tert-/- in the gut (graph in fig A–ca. 6.8 Kb) and muscle (graph in fig B–ca. 8.5 Kb) but not in testis (graph in fig C), indicated by blue arrow. N = 3–4 per time point for tert-/- gut and muscle, N = 4–6 per time point for tert-/- testis. TRF mean sizes were calculated as previously described [54]. Data are represented as mean +/- SEM. PHENOTYPE:
|

Shortening of mTL anticipates accumulation of DDR markers, decrease in cell proliferation and increase in apoptotis with age. A-D) Representative immunofluorescence images of DNA damage (γH2AX), proliferation (PCNA) and apoptosis (TUNEL) for gut (A—dashed outline identifies the villi), kidney marrow (B), testis (C) and muscle (D—dashed outline identifies the fibers) of WT (at 3, 12 and 36 months) and tert-/- mutant siblings (at 3 and 12 months). All tissues show a significant increase in cells bearing five or more γH2AX foci by 12 months of age in tert-/- zebrafish (panels b, d) and by 36 months in WT zebrafish (panels a, c and e). Increased DNA Damage Response (DDR) correlates with shorter mTL in Ea) Gut (p = 0.021) and Ej) Muscle (p = 0.044) but not Ed) Kidney Marrow or Eg) Testis. Grey shaded area identifies the median telomeric length at which significant DDR activation is observed in tert-/- mutants (Ea, Ed, Eg, Ej). Proliferative tissues, A) gut B) kidney marrow and C) testis, show a sustained decrease in cell proliferation by 12 months of age in tert-/- (panels g, i) and by 36 months in WT tissues (panels f, h and j). Eb) Decrease in proliferation correlates with shorter mTL in the gut (p = 0.015). Grey shaded area identifies the median telomeric length at which significant proliferation defects are observed in tert-/- mutants (Eb, Ee, Eh). tert-/- mutants’ A) gut B) kidney marrow and C) testis show increased apoptotic responses at 3 months when compared with WT controls (panel l). WT zebrafish show a continuous accumulation of apoptotic signals with age (panels k, m, o). Apoptotic responses are not anticipated by shorter mTL (Ec, Ef, Ei, El). Grey shaded area identifies the median telomeric length at which significant apoptotic responses are observed in tert-/- mutants (Ec, Ef, Ei, El). Most DDRs and apoptotic signals locate to the proliferative zone of maturing spermatocytes (C—dashed outline). WT and tert-/- age groups are indicated in each graph by black and red colored numbers, respectively. Immunofluorescence (IF) quantifications were performed in at least 3 different fields of view for 3–5 different individuals per time point per genotype. Gut IF quantifications were calculated as number of positive cells per “crypt” zone. Other tissues′ IF was quantified as overall % positive cells. Scale bar = 50 µm. N = 3–6 for tissue mTL quantifications per genotype per time point (x-axis in graphs of Fig 3E). IF and mTL quantifications are represented as mean +/- SEM. |

Telomere shortening culminates in tissue defects associated with aging. |
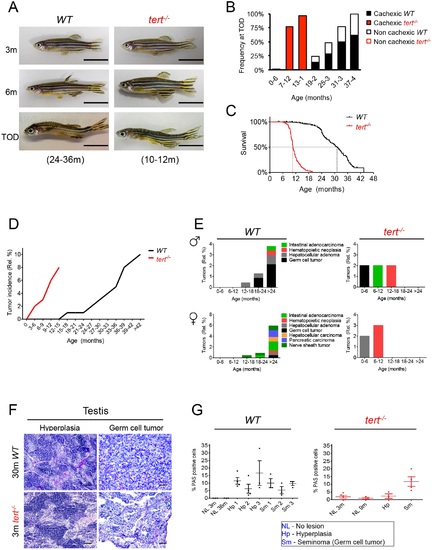
tert-/- mutants accelerate the onset of age-associated cachexia and neoplasia.tert-/- mutants accelerate the onset of age-associated cachexia and neoplasia.A) Representative images of WT and tert-/- mutants show that, at time-of-death (TOD), zebrafish exhibit signs of cachexia and deformation of the spine, with very low body mass indexes. B) In WT population the incidence of these alterations increases with age, while in tert-/- mutants, at TOD, 100% of the population is affected. C) Sustained cachexia in older zebrafish is accompanied by an increase in mortality as shown by Kaplan Meier curves of WT and tert-/- zebrafish. WT zebrafish have a half-life of 30.8m, 3x greater than the half-life of 10.6m of tert-/- (p<0.0001). N = 426 WT; N = 98 tert-/-, for Fig 5A–5C. TOD corresponds to the interval comprising the second and third quartiles of survival (25 to 75%). Scale bar = 1 cm. D) Tumorigenesis exponentially accelerates with age in both WT and tert-/- zebrafish, reaching cumulative incidences of ca. 10% and ca. 8%, respectively. N = 23/238 WT; N = 5/66 tert-/-. tert-/- mutants have an earlier onset of neoplasia starting at 4 months of age (p = 0.003). E) Tumors in WT male zebrafish affect mainly the reproductive system, following the appearance of Periodic Acid Shift (PAS+) stained cells in the tissue stroma (F), (quantified in G). WT females show an even distribution of tumors between reproductive and hematopoietic systems, followed by liver, intestine and pancreas. N = 118 WT males; N = 120 WT females; N = 58 tert-/- males; N = 8 tert-/- females. Quantifications of %PAS+ cells was performed in 3 fields of view for each individual in the graph. Scale bar = 50 µm. Data are represented as mean +/- SEM. PHENOTYPE:
|
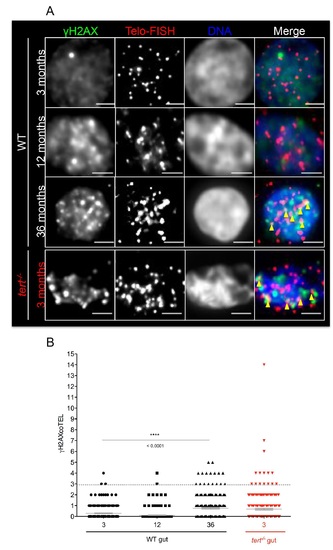
The number of telomere induced foci (TIF) increases with age in the gut.A) Representative immunofluorescence staining of γ-H2AX foci (green) and telomeres by FISH (red) in cells isolated (cytospin) from the gut of 3, 12 and 36 month-old WT and 3-months tert-/-. Yellow arrowheads point to co-localization of γ-H2AX and telomere signal–TIFs. Compared to 3-months, the number of TIFs increases significantly with age in the gut of 36 months (p<0.0001) and 3 month-old tert-/- zebrafish (p<0.0001), as shown by quantifications in B). Scale bar = 1 µm. Data are represented as mean +/- SEM. N = 3 individuals, per age per time point per genotype (N = 250 cells). |

Increase in senescence with age is anticipated by shorter mTL.A) Representative haematoxylin-eosin and senescence-associated β-galactosidase (SA-β-gal) staining in gut, kidney marrow and testis sections of WT (at 3, 12 and 24 months) and tert-/- mutant siblings (at 3 and 12 months). A significant increase in SA-β-gal positive cells is seen by 12 months of age in tert-/- tissues and by 24 months in WT tissues (when comparing both with 3 month-old controls). No staining is observed in the muscle. B) Increase in SA-β-gal staining does not significantly correlate with mTL decline in any of the tissues tested. Grey shaded area identifies the telomeric length at which significant SA-β-gal staining is observed in tert-/- mutants’ tissues. WT and tert-/- age groups are indicated in each graph by black and red colored numbers, respectively. Quantifications of SA-β-GAL signal were performed using an arbitrary scale of signal intensity (where weaker signal is represented by 1 and stronger signal by 4). N = 3–6 per genotype per time point. Scale bar = 50 µm. N = 3–6 for tissue mTL telomere length quantifications per genotype per time point (x-axis in graphs of S6B Fig). Data are represented as mean +/- SEM. |
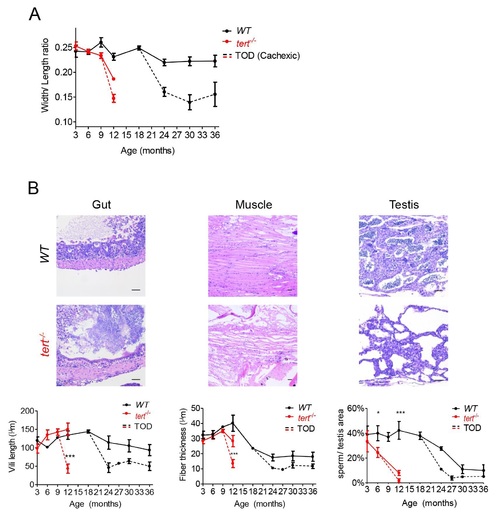
Cachexia at time of death is associated with lower body mass, gut villi shortening and marked muscle and testis atrophy.A) Quantification of width/length ratios shows that at time of death (TOD), both WT and tert-/- zebrafish have significantly lower body mass indexes when compared with non-cachexic siblings (N = 4–17 per time point for WT zebrafish and N = 3–7 for tert-/- mutants). B) Representative hematoxilin and eosin-stained sections of gut, muscle and testis from WT and tert-/- siblings at TOD. B) Cachexia is associated with shorter villi and/or villous atrophy (defined as flattening of the gut mucosal surface, N = 3–6 per genotype per time point) and severe myocyte atrophy and degeneration (N = 3–6 per genotype per time point), to a higher degree than that found for non-cachexic siblings. Testis also shows pronounced atrophy, with reduced germ cell compartment associated with cachexia (N = 3–4 per genotype per time point). TOD corresponds to the interval comprising the second and third quartiles of survival (25 to 75%). Quantifications were performed in at least 3 different fields of view for each individual. Scale bar = 50 µm. Data are represented as mean +/- SEM. |

Subcutaneous adipose tissue progressively disappears with aging whereas visceral reserves maintain until later ages.Representative hematoxilin and eosin-stained sections of subcutaneous (A) and visceral (B) adipose tissue depots of WT (3, 12 and 36 months and TOD) and tert-/- siblings (3 and 12 months and TOD), and C) quantification of the adipocyte vacuole diameter at different ages. A) WT zebrafish show a progressive loss of the subcutaneous depot, with age, C) accompanied by a reduction in the adipocytes’ vacuole diameter (adipocytes are ~3.3 times smaller at 36 months vs. 3 months). tert-/- anticipate this phenotype by 12 months of age. With cachexia, both WT and tert-/- zebrafish show complete exhaustion of the subcutaneous adipose tissue depot (at TOD). B) Visceral adipose tissue (peri-pancreatic) is reduced or absent at 36 months in WT zebrafish (when adipocytes are ~3 times smaller than at 3 months) and by 12 months in WT mutants; and similarly to subcutaneous depot, exhaustion of visceral adipose reserves associates with cachexia. N = 3–7 zebrafish per genotype per time point. Time of death (TOD) corresponds to the interval comprising the second and third quartiles of survival (25 to 75%) Scale bar = 50 µm. Data are represented as mean +/- SEM. |
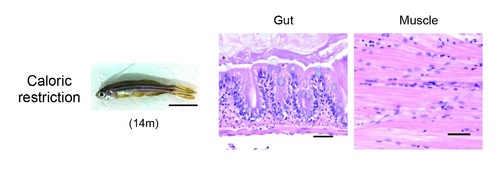
Muscle atrophy, but not gut villi degeneration, is the consequence of a poor nutritional body state in cachexic zebrafish.Representative picture and hematoxilin and eosin-stained sections of 12-month old WT after 8 weeks of caloric restriction, where food intake was reduced by 85%. Upon caloric restriction, gut villi length is maintained within a normal range (when compared with non cachexic 12-month old WT–see Fig 4A) but myocytes show atrophy to a similar degree as seen in cachexic WT and tert-/- zebrafish. N = 4. Scale bar = 50 µm. |