
- Title
-
Microtubule-associated protein 1b is required for shaping the neural tube
- Authors
- Jayachandran, P., Olmo, V.N., Sanchez, S.P., McFarland, R.J., Vital, E., Werner, J.M., Hong, E., Sanchez-Alberola, N., Molodstov, A., Brewster, R.M.
- Source
- Full text @ Neural Dev.
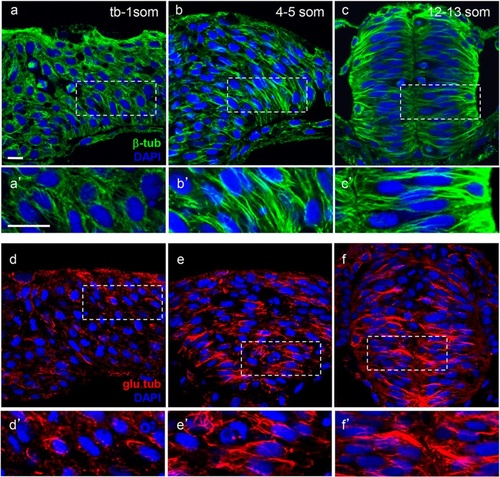
Microtubules become increasingly stabilized during neurulation. Hindbrain sections of embryos at the neural plate (tb-1 som) (a, a′, d, d′), neural keel (4–5 som) (b, b′, e, e′) and neural rod (12–13 som) (c, c′, f, f′) stages immunolabeled with anti-β-tub (total MTs) in green (a–c′) and anti-glu-tub (detyrosinated MTs) in red (d–f′). (a′–c′) and (d′–f′) Higher magnification of boxed areas in (a–c) and (d–f), respectively. Scale bars: 10 µm EXPRESSION / LABELING:
|

Distribution of dynamic microtubules during neurulation. Hindbrain sections of embryos at the neural plate (tb-1 som) (a1–a3), neural keel (4–5 som) (b1–b3) and neural rod (12–13 som) (c1–c3′) stages immunolabeled with anti-tyr-tub (dynamic MTs) in red (a1, b1, c1, c1′), anti-β-tub (total MTs) in green (a2, b2, c2, c2′). (a3, b3, c3, c3′) Red-Green overlay (yellow) of images in (a1-c2′) with nuclei labeled in blue using DAPI. (c1′-c3′) Higher magnification of boxed areas in (c1–c3). Arrows indicate high overlap between anti-tyr-tub and anti-β-tub; arrowheads indicate area of reduced overlap between these two markers. Scale bars: 10 µm EXPRESSION / LABELING:
|

Regulation of microtubule dynamics is required for NC. a Dorsal views of untreated, nocodazole-treated (5 µg/ml) and paclitaxel-treated (50 µM) embryos labeled by in situ hybridization with the dlx3 riboprobe. Double red arrowheads indicate the width of the neural plate. Scale bar: 100 µm . b Quantification of the neural plate width (µm) in control (untreated) and drug-treated embryos. (*) indicates statistical significance (P <0.001 for untreated vs nocodazole and untreated vs paclitaxel) using a Kruskal-Wallis test followed by Dunn’s post-hoc test. c Quantification of the length-to-width (LWR) ratio of mGFP-labeled cells in control (untreated), nocodazole-treated, and paclitaxel-treated embryos at the 4–5 som stage. (*) indicates statistical significance (P <0.001 for untreated vs nocodazole and P <0.01 for untreated vs paclitaxel) using a Kruskal-Wallis test followed by Dunn’s post-hoc test. d Hindbrain sections of 4–5 som control (untreated), nocodazole-treated and paclitaxel-treated embryos mosaically expressing mGFP (green). Nuclei are labeled in blue with DAPI. Double arrows indicate cell length. The dotted white line represents the midline. Scale bar: 10 µm EXPRESSION / LABELING:
PHENOTYPE:
|
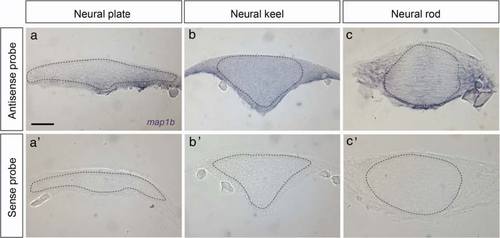
map1b mRNA distribution. Expression of map1b mRNA in hindbrain sections detected by in situ hybridization using anti-sense (a, b and c) or sense (a′, b′ and c′) probes. (a, a′) neural plate, (b, b′) neural keel, (c, c′) neural rod stage embryos. The neural tissue is delineated by a dotted line. Scale bar: 20 µm EXPRESSION / LABELING:
|
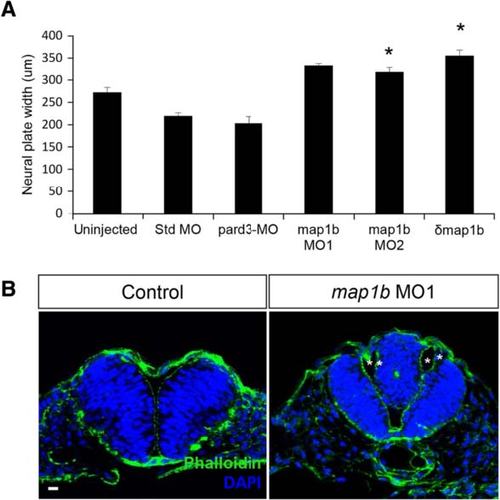
map1b depletion causes NC defects. a Quantification of the width of the neural plate (µm). (*) Indicates statistical significance (P <0.01 for uninjected vs map1b MO2; P <0.001 for uninjected vs δmap1b-injected) using a Kruskal-Wallis test followed by Dunn’s post-hoc test. b Hindbrain sections of uninjected and map1b MO1-injected embryos at 24hpf, labeled with Phalloidin (cortical actin, green) and DAPI (nuclei, blue). Asterisks indicate the ventricles of the duplicated neural tube. Scale bar: 10 µm |
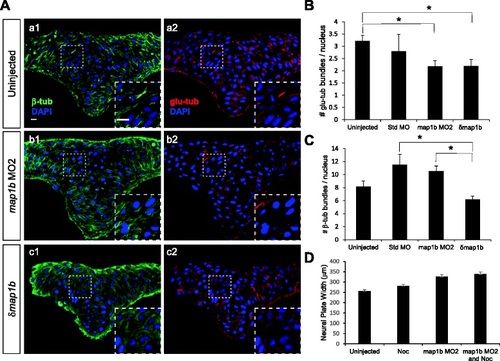
Microtubule stability is altered in Map1b-depleted embryos. a Hindbrain sections of uninjected (a1, a2), map1b MO2-injected (b1, b2) and δmap1b-injected (c1, c2) embryos at 4–5 som immunolabeled with anti-β-tub (green, a1, b1, c1) and anti-glu-tub (red, a2, b2, c2). Nuclei are labeled in blue with DAPI. Insets show higher magnification of boxed areas. Scale bars: 10 µm. b Quantification of the average number of glu-tub - labeled bundles per nucleus in uninjected, standard MO-injected, map1b MO2-injected and δmap1b-injected embryos. (*) Indicates statistical significance (P <0.05 for uninjected vs map1b MO2 and P <0.05 for uninjected vs δmap1b-injected) using ANOVA followed by a Bonferroni post test. c Quantification of the average number of β-tub labeled bundles per nucleus in uninjected, standard MO-injected, map1b MO2-injected and δmap1b-injected embryos. (*) Indicates statistical significance (P <0.01 for standard MO vs δmap1b-injected) using ANOVA followed by a Bonferroni post test (d) Quantification of the neural plate width in control (uninjected), map1b MO2-injected embryos, nocodazole (3 µM)-treated embryos, and map1b MO1-injected embryos treated with nocodazole EXPRESSION / LABELING:
PHENOTYPE:
|
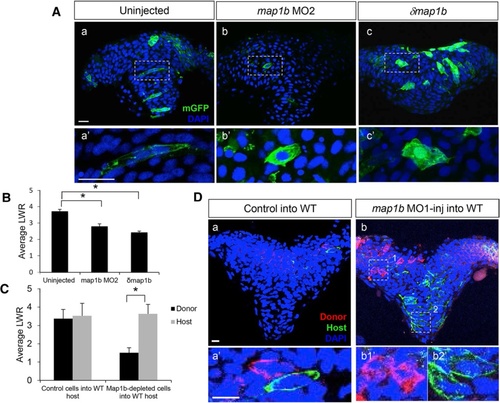
Map1b functions cell autonomously in the neural ectoderm. a Hindbrain sections of 4–5 som uninjected (a, a′), map1b MO2-injected (b, b′) and δmap1b-injected (c, c′) embryos mosaically-expressing mGFP (green). Nuclei are labeled in blue with DAPI. (a′–c′) Higher magnification of boxed areas in (a–c) respectively. Scale bars: 20 µm. b Quantification of the LWR of cells in 4–5 som uninjected, map1b MO2-injected and δmap1b-injected embryos. (*) Indicates statistical significance (P <0.01 for uninjected vs map1b MO2 and P <0.001 for uninjected vs δmap1b-injected) using a Kruskal-Wallis test followed by Dunn’s post-hoc test. c Quantification of the LWR of control donor cells vs host WT cells and map1b MO1-injected donor cells vs host WT cells. (*) Indicates statistical significance (P <0.0001) using Student’s T-test. d Hindbrain sections of 4–5 som WT hosts mosaically-expressing mGFP and transplanted with (a) mRFP-labeled control donor cells or (b) mRFP-labeled map1b-MO1 donor cells. Nuclei are labeled with DAPI (blue). (a′, b1′ and b2′) Higher magnifications of boxed areas in (a, b1 and b2) respectively. Scale bars: 10 µm PHENOTYPE:
|
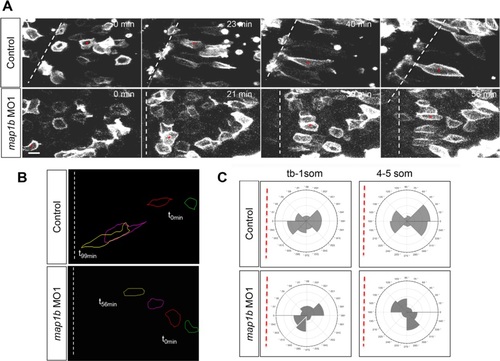
Polarized migration is disrupted in Map1b-depleted embryos. a Selected frames from time-lapse imaging of control (uninjected) and map1b-depleted mGFP-expressing cells in the neural plate. The white dotted line indicates the dorsal midline, when visible in the imaging field. Time elapsed (minutes) is indicated in the upper right corner. Red asterisks indicate individual cells identified in multiple frames. Scale bar: 10 µm. b Representative traces of control and map1b-depleted cells traced over time. Traces corresponding to time 0 (t0 min, green) are to the right and traces of older cells (t56 min and higher, yellow) are to the left. c Plot of the average distribution of membrane protrusions in representative mGFP- labeled control and map1b-depleted cells at the neural plate stage. The red dotted line represents the position of the dorsal midline. PHENOTYPE:
|
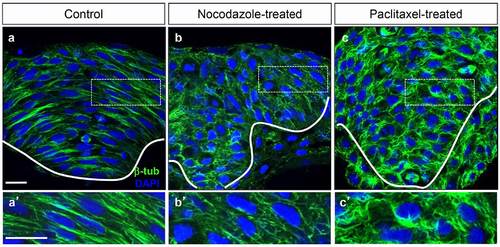
Nocodazole and paclitaxol disrupt microtubule organization. (a-c′) Hindbrain sections of 4–5 som control (a, a′), nocodazole-treated (b, b′) and paclitaxel-treated (c, c′) embryos immunolabeled with anti-β-tub. (a′-c′) Higher magnifications of boxed areas in panels (a,b and c) respectively. Scale bars: 20 µm. |
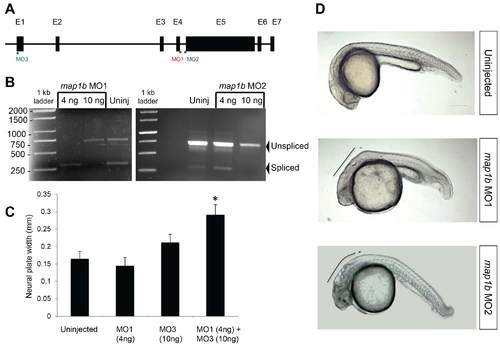
Efficacy of map1b MOs. (A) Schematic representation of zebrafish map1b, showing map1b MO1 binding site at the exon 4- intron 4 splice junction (red line and lettering), map1b MO2 binding site at the intron 4- exon 5 splice junction (blue line and lettering) and map1b MO3 at the translational start site (green line and lettering). Exons are represented by black boxes with corresponding numbers on top. (B) RT-PCR analysis of the region targeted by splice MOs . The upper (750bp) and lower (300bp) bands correspond to unspliced and spliced product respectively. (C) Quantification of the width of the neural plate (tb- 1 som) of control embryos and embryos injected with map1b MO1 (4 ng), map1b MO3 (10 ng) and map1b MO1 (4 ng) + map1b MO3 (10 ng). * Indicates statistical significance using a Kruskal-Wallis test followed by Dunn’s post-hoc test (P <0.05 compared to the rest of the groups). (D) Side views of 24 hpf uninjected, map1b MO1-injected (10 ng) and map1b MO2-injected (10 ng) embryos. Black line indicates morphological defects in the hindbrain region. Anterior is to the left, dorsal is up. Scale bar: 250 µm. |
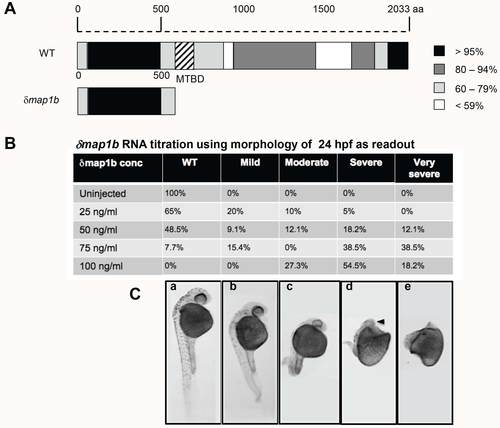
δmap1b construct and RNA titration. Representation of zebrafish full length Map1b and δMap1b protein indicating percent amino acid similarity to human ortholog. Black represents the highest level of homology and white, the lowest. Hatch marks indicate the MT-binding domain (MTBD). (B) Titration analysis of δmap1b RNA. Percent of embryos with WT, mild, moderate, severe and very severe phenotypes are indicated in the table for each concentration of RNA. (C) 24 hpf embryos correspond to the phenotypic categories in the table (a: WT, b: mild, c: moderate, d: severe e: very severe). Black arrowhead indicates missing eye. |
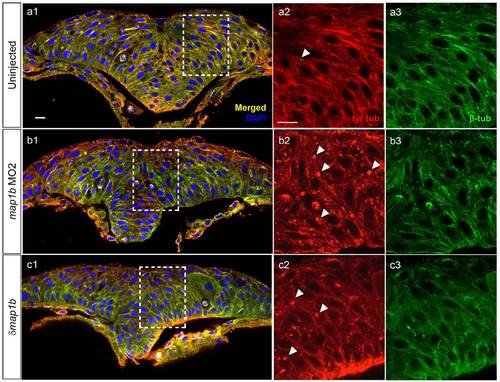
Dynamic microtubules appear normal in Map1b-depleted embryos. Hindbrain sections of embryos at the neural keel (4–5 som) stage immunolabeled with anti-tyr-tub (dynamic MTs) in red (a2, b2, c2) anti-β-tub (total MTs) in green (a3, b3, c3). (a1, b1, c1) Red-Green overlay (yellow) with nuclei labeled in blue using DAPI. Boxed areas are shown in higher magnification in (a2-c3). Arrowheads indicate puncta exclusively labeled with anti-tyr-tub. Scale bars: 10 µm. |