
|
Fig. S3
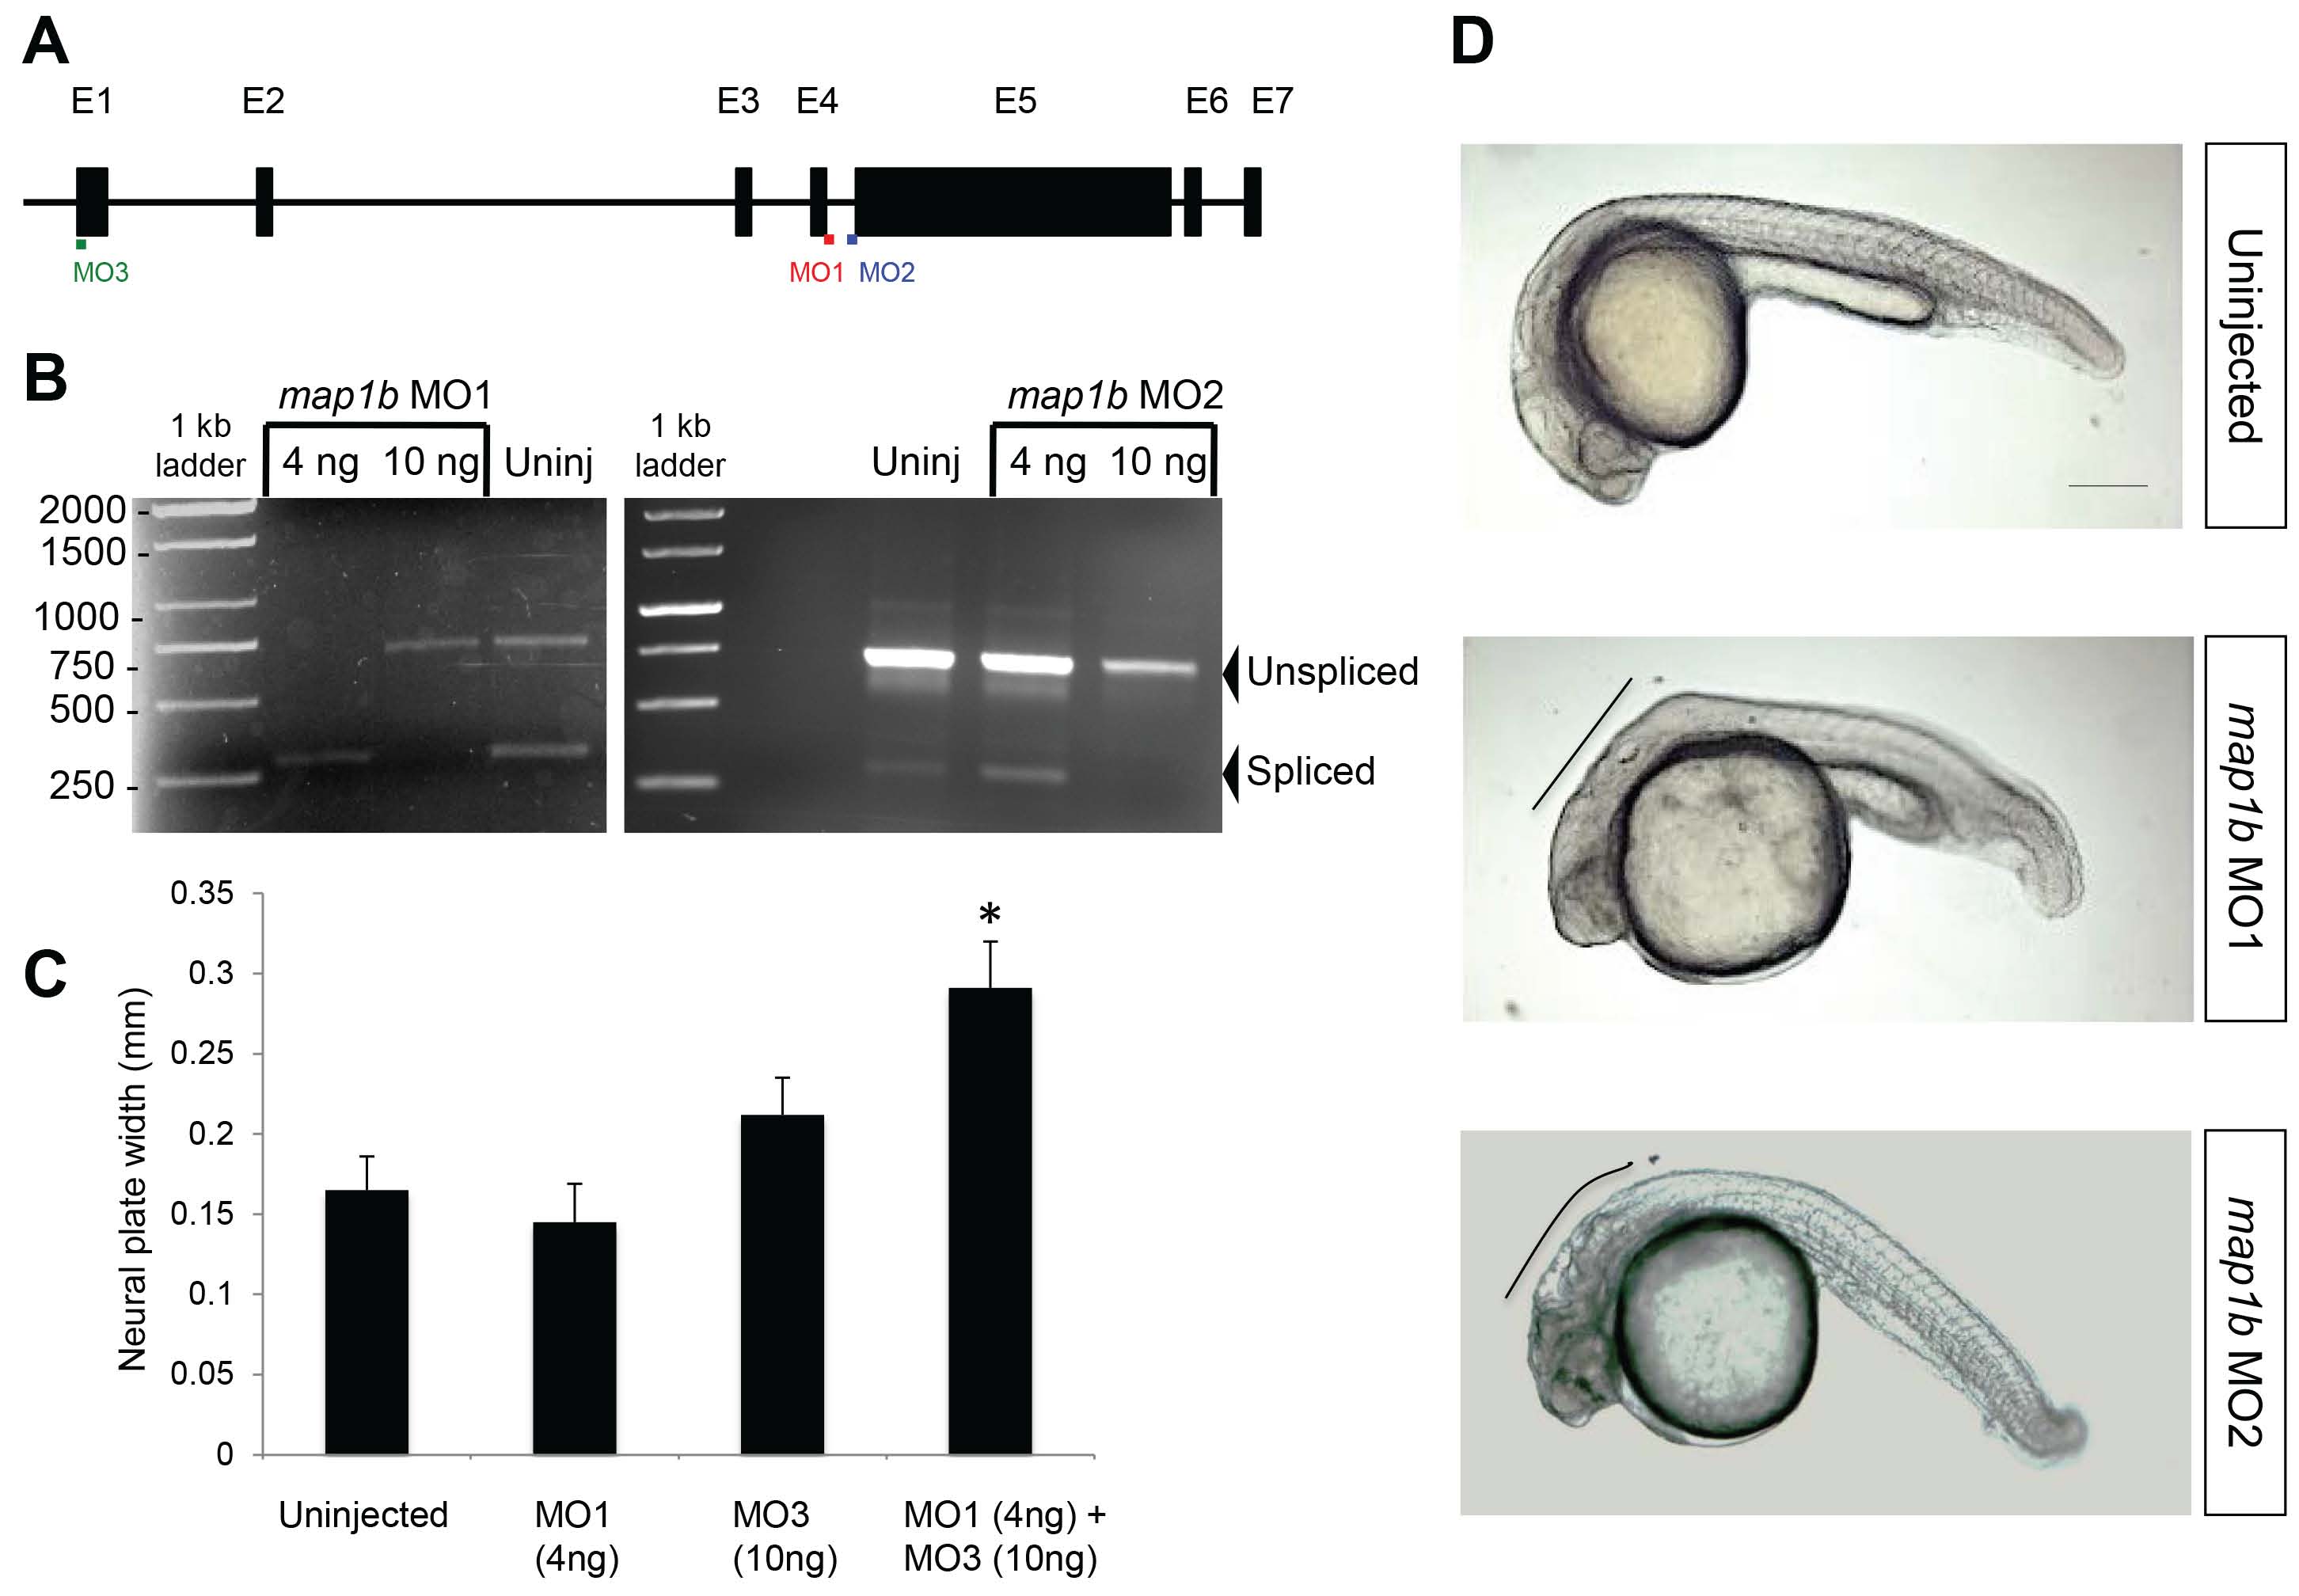
Efficacy of map1b MOs. (A) Schematic representation of zebrafish map1b, showing map1b MO1 binding site at the exon 4- intron 4 splice junction (red line and lettering), map1b MO2 binding site at the intron 4- exon 5 splice junction (blue line and lettering) and map1b MO3 at the translational start site (green line and lettering). Exons are represented by black boxes with corresponding numbers on top. (B) RT-PCR analysis of the region targeted by splice MOs . The upper (750bp) and lower (300bp) bands correspond to unspliced and spliced product respectively. (C) Quantification of the width of the neural plate (tb- 1 som) of control embryos and embryos injected with map1b MO1 (4 ng), map1b MO3 (10 ng) and map1b MO1 (4 ng) + map1b MO3 (10 ng). * Indicates statistical significance using a Kruskal-Wallis test followed by Dunn’s post-hoc test (P <0.05 compared to the rest of the groups). (D) Side views of 24 hpf uninjected, map1b MO1-injected (10 ng) and map1b MO2-injected (10 ng) embryos. Black line indicates morphological defects in the hindbrain region. Anterior is to the left, dorsal is up. Scale bar: 250 µm.