
- Title
-
BMP Sustains Embryonic Stem Cell Self-Renewal through Distinct Functions of Different Krüppel-like Factors
- Authors
- Morikawa, M., Koinuma, D., Mizutani, A., Kawasaki, N., Holmborn, K., Sundqvist, A., Tsutsumi, S., Watabe, T., Aburatani, H., Heldin, C.H., Miyazono, K.
- Source
- Full text @ Stem Cell Reports
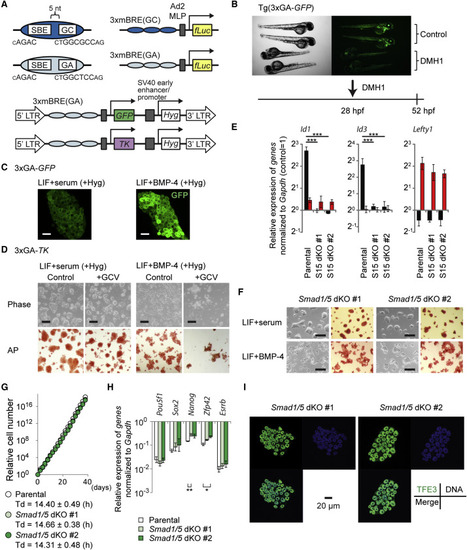
BMP-SMAD Pathway Is Dispensable for Maintaining Naive Pluripotency (A) Schematic presentation of BMP reporter constructs. Fragments with GGCGCC (GC) or GGAGCC (GA) sequences together with SBE were triplicated and fused with reporter genes. TK, herpes simplex virus type 1 thymidine kinase gene. (B) A BMP type I receptor inhibitor, DMH1 (5 µM), attenuated GFP expression in Tg(3xGA-GFP) transgenic fish in vivo. Control, head to the right position; DMH1, head to the left position. (C) Expression of GFP in 3xGA-GFP cells in LIF+serum or LIF+BMP-4. Scale bar, 40 µm. (D) Negative selection with ganciclovir (GCV) in 3xGA-TK cells. Upper: Phase contrast. Lower: AP staining. Scale bar, 200 µm. (E) qRT-PCR analysis to evaluate BMP responsiveness. Cells were stimulated with 50 ng/ml BMP-4 or 50 ng/ml activin A for 1.5 hr. Data represent means ± SEM of three independent experiments. p < 0.001 versus parental mESCs. S15 dKO, Smad1/5 double knockout . (F) Morphology (left) and AP activity (right) of Smad1/5 dKO lines in LIF+serum and LIF+BMP-4. Scale bar, 200 µm. (G) Proliferation and doubling time (Td) of parental mESCs and Smad1/5 dKO cell lines maintained in LIF+serum. A representative growth curve data is shown. Td (mean ± SEM) was calculated using three independent experiments. (H) qRT-PCR analysis of Smad1/5 dKO cell lines cultured in LIF+serum. Data represent means ± SEM of three independent experiments. *p < 0.05, **p < 0.01 versus parental mESCs. (I) Expression and localization of TFE3 (green), DNA/DRAQ5 (blue), and their merge in Smad1/5 dKO lines in LIF+serum. Scale bar, 20 µm. See also Figure S2. |
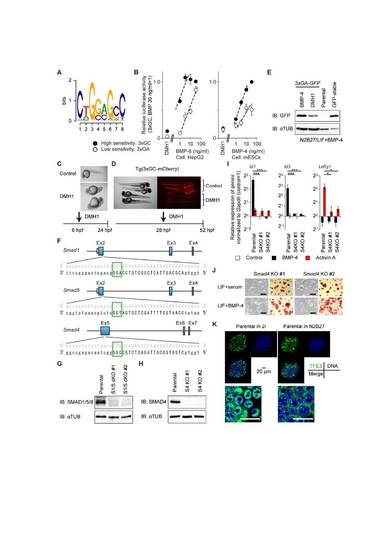
The BMP-SMAD pathway is dispensable for maintenance of a naïve pluripotent state, related to Figure 3. (A) SMAD1/5 binding motif, GS-SBE (Morikawa et al., 2011), is displayed as a sequence logo. (B) HepG2 and mESCs were transfected with indicated reporter constructs to evaluate their enhancer activity. The cells were stimulated with the indicated concentrations of BMP-6 for HepG2 or BMP-4 for mESCs at 24 h after transfection; the cells were harvested and assayed for luciferase activity after 16 h of stimulation. Data represent means ± SEM of three independent experiments. (C) Application of a BMP type I receptor inhibitor, DMH1 (5 µM), inhibited BMP signaling in developing embryos and dorsalized the embryonic axis. (D) Detection of fluorescent proteins in Tg(3xGC-mCherry) transgenic fish in vivo; the expression was severely attenuated when embryos were treated with DMH1 (5 µM). Control: head to the right position, DMH1: head to the left position. (E) Western blot for GFP in mESCs introduced with 3xGA-GFP and maintained in LIF+BMP-4 with or without DMH1 (3 µM) for 24 h. α-TUBULIN (αTUB) was used as a loading control. (F) Schematic illustration of the CRISPR-Cas9/guide RNA (gRNA)-targeting sites in the Smad1, Smad5 and Smad4 gene loci. The gRNA-targeting sequence is written in capital letters, and the protospacer-adjacent motif (PAM) sequence is marked by a green-colored box. (G) Western blot for SMAD1/5/8 in Smad1/5 double-knockout (dKO) lines. α-TUBULIN was used as a loading control. (H) Western blot for SMAD4 in Smad4 KO lines. α-TUBULIN was used as a loading control. (I) qRT-PCR analysis to evaluate BMP and Activin responsiveness. Cells were stimulated with 50 ng/ml BMP-4 or 50 ng/ml Activin A for 1.5 h and subjected to qRT-PCR analysis. Data represent means ± SEM of three independent experiments, * p < 0.05 and *** p < 0.001 versus parental mESCs. See also Figure 3E. These analyses were performed simultaneously. The data for parental mESCs were also used in Figure 3E. (J) Morphology (left) and AP activity (right) of Smad4 KO lines in LIF+serum and LIF+BMP-4. Scale bar: 200 µm. (K) Expression and localization of TFE3 (green), DNA/DRAQ5 (blue), and their merge in parental E14 mESCs. Cells were cultured in 2i or N2B27 basal media for 24 h. (Lower) Higher magnification of merged images. Scale bar: 20 µm. |