
- Title
-
Ferredoxin 1b (Fdx1b) is the essential mitochondrial redox partner for cortisol biosynthesis in zebrafish
- Authors
- Griffin, A., Parajes, S., Weger, M., Zaucker, A., Taylor, A.E., O'Neil, D.M., Müller, F., Krone, N.
- Source
- Full text @ Endocrinology
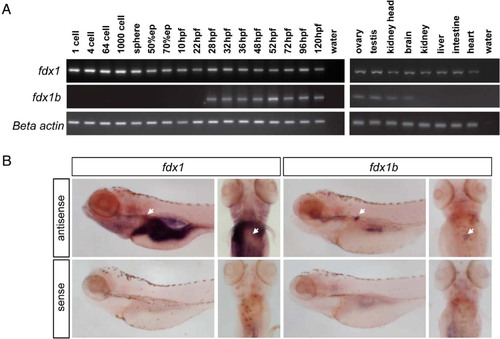
Temporal and spatial expression of zebrafish fdx1 paralog genes. A, Expression of fdx1 and fdx1b was characterized in zebrafish during development and in adult tissues. Representative agarose gel images are shown from triplicate experiments from pools of 10 zebrafish embryos or larvae at the specified developmental stages or from adult tissues. β-Actin was used as a control for integrity of template cDNA. B, Detection of fdx1 and fdx1b mRNA at 120 hpf by WISH. Lateral and dorsal views are shown. Negative control sense probes did not show staining. Arrow indicates location of the interrenal gland. |
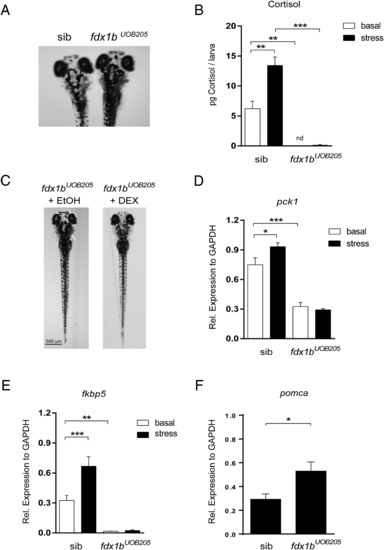
Zebrafish fdx1bUOB205 homozygous mutants are glucocorticoid deficient. A, fdx1bUOB205 homozygous mutants have impaired visual-mediated adaption. When exposed to a lighter environment, fdx1bUOB205 homozygous mutants are darker in appearance when compared with control siblings, which had a least 1 wild-type allele (fdx1b+/+ or fdx1bUOB205/+). B, Cortisol concentrations were determined from fdx1bUOB205 homozygous mutant larvae (fdx1bUOB205) and sibling controls (sib) under basal and stressed conditions. Cortisol was not detected (nd) from fdx1bUOB205 homozygous mutants under basal conditions. Concentrations were determined from 3 independent replicates and are expressed as picograms per larva (mean ± SD). C, Treatment of fdx1bUOB205 homozygous mutants with the glucocorticoid agonist dexamethasone (DEX) restored the light adaptation phenotype in contrast to ethanol-treated controls (EtOH). mRNA expression of glucocorticoid response genes (D) pck1 and (E) fkbp5 in fdx1bUOB205 homozygous mutants and control siblings under basal and stressed conditions. Graphs represent mean relative expression ± SEM (normalized to gapdh). F, Quantitative real-time expression of pomca in fdx1bUOB205/UOB205 mutants relative to control siblings. Statistical analysis was performed using one-way ANOVA; *, P < .05; **, P < .01; ***, P < .001. |

ZFIN is incorporating published figure images and captions as part of an ongoing project. Figures from some publications have not yet been curated, or are not available for display because of copyright restrictions. PHENOTYPE:
|
|
ZFIN is incorporating published figure images and captions as part of an ongoing project. Figures from some publications have not yet been curated, or are not available for display because of copyright restrictions. |
|
ZFIN is incorporating published figure images and captions as part of an ongoing project. Figures from some publications have not yet been curated, or are not available for display because of copyright restrictions. PHENOTYPE:
|
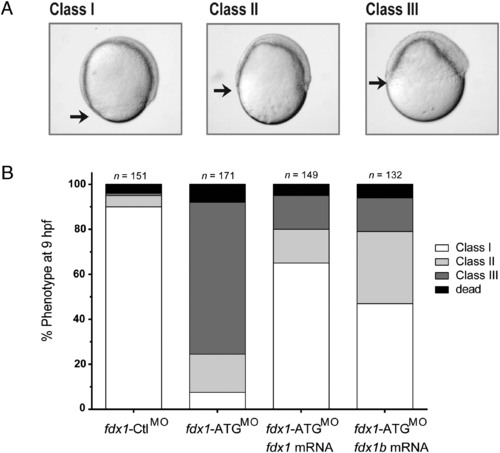
Morphological phenotype of embryos injected with fdx1 morpholino at 9 hpf. A, Embryos injected with fdx1-ATGMO, fdx1-SplMO, or fdx1-CtlMO were classified based on their progression of epiboly at 9 hpf. Class I represents a normal epiboly, and class II and class III represent delayed movement as indicated by the black arrow. B, Injection of 9 ng of fdx1-CtlMO showed 95% of the normal class I phenotype compared with fdx1-ATGMO-injected embryos, which had 68.9% class II and 18% class III. Coinjection of either fdx1 or fdx1b mRNA with fdx1-ATGMO partially restored embryos to a class I phenotype. PHENOTYPE:
|