
- Title
-
Lamination Speeds the Functional Development of Visual Circuits
- Authors
- Nikolaou, N., Meyer, M.P.
- Source
- Full text @ Neuron
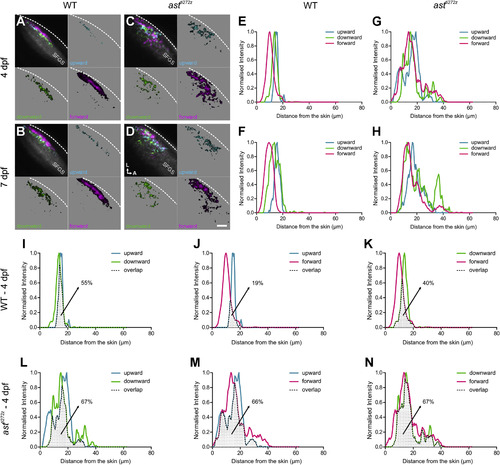
Lamination of DS-RGC Axons in the Tectum Is Lost in astray Mutants (A–D) Composite parametric maps generated from all Tg(Isl2b:Gal4;UAS:SyGCaMP3) fish imaged showing the spatial distribution of DS-RGC subtypes in the tectal neuropil of WT larvae (n = 8, total of 24 optical sections) at 4 dpf (A) and 7 dpf (B), and astti272z larvae (n = 9, total of 27 optical sections) at 4 dpf (C) and 7 dpf (D). Voxel brightness is proportional to the summed incidence of each functional subtype across all larvae imaged. The standard space template image derived from the mean fluorescence image of SyGCaMP3-expressing axons (grayscale) provides an anatomical reference. Dashed lines indicate the position of the skin overlaying the tectum. Scale bar represents 20 µm. A, anterior; L, lateral; SFGS, stratum fibrosum et griseum superficiale. (E–H) Line plots generated from the composite parametric maps in (A)–(D) illustrating the distribution of DS-RGC subtypes along the laminar axis of the tectum in WT larvae at 4 dpf (E) and 7 dpf (F), and astti272z larvae at 4 dpf (G) and 7 dpf (H). Line plots show normalized intensity of each DS-RGC subtype as a function of its distance from the skin. (I–N) Pairwise comparisons showing the degree of spatial overlap between upward and downward (I and L), upward and forward (J and M), and downward and forward (K and N) DS-RGC subtypes within WT (I–K) and astti272z (L–N) tecta at 4 dpf. Dotted area represents the area of intersection between the two subtypes. Values shown represent the fraction of downward (for I and L) or forward (for J, K, M, and N) DS voxels that spatially overlap with upward or downward DS voxels. See also Figures S2 and S3. |
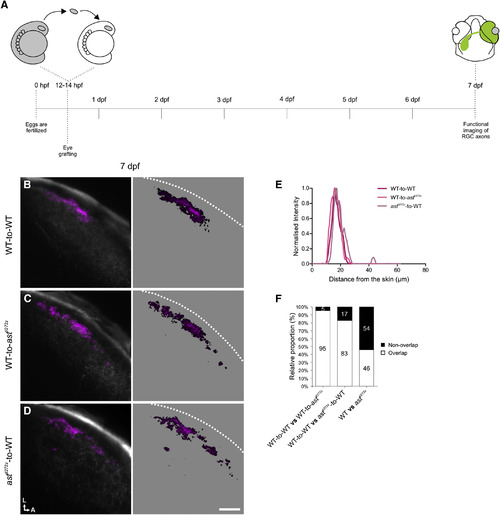
robo2+/+ Tectal Cell Dendrites Provide Positional Cues for robo2/ RGC Axons (A) Schematic showing the experimental procedure followed. Optic vesicles from Tg(Isl2b:Gal4;UAS:SyGCaMP3) donor embryos were transplanted into hosts at 12–14 hpf and functional imaging of donor RGC axons within the tectum was performed at 7 dpf. (B–D) Composite parametric maps across all fish imaged showing the spatial distribution of forward tuned DS voxels in the tectal neuropil of WT-to-WT (n = 8 larvae, total of 24 optical sections) (B), WT-to-astti272z (n = 4 larvae, total of 12 optical sections) (C), and astti272z-to-WT (n = 4 larvae, total of 12 optical sections) (D). Within individual parametric maps, voxel brightness is proportional to the summed incidence of the functional subtype across all larvae imaged. The standard space template image derived from the mean fluorescence image of SyGCaMP3-expressing axons (grayscale) provides an anatomical reference. Dashed lines indicate the position of the skin overlaying the tectum. Scale bar represents 20 µm. A, anterior; L, lateral. (E) Line plots generated from the composite parametric maps in (B)–(D) illustrating the laminar organization of forward tuned DS voxels within each group. Line plots show normalized intensity of DS voxels as a function of distance from the skin. (F) Pairwise comparisons showing the extent of spatial overlap in the distribution of forward tuned DS voxels in the different experimental groups. Note the increased fraction of correctly positioned DS voxels in transplanted astti272z axons (astti272z-to-WT group) compared with the astti272z condition. |
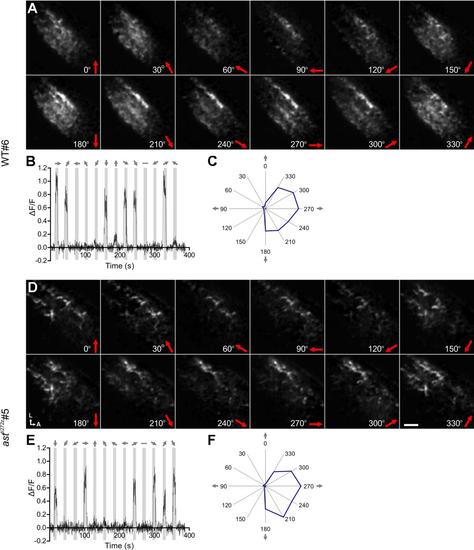
Responses of SyGCaMP3-expressing RGC axons terminating in the optic tectum (related to Figure 1). Examples of tuning experiments from WT (A-C) and astti272z (D-F) Tg(Isl2b:Gal4;UAS:SyGCaMP3) larvae at 7 dpf are shown. (A, D) Montages showing integral responses (grayscale) of all RGC axons in the tectum. Direction of motion is shown on the bottom right in each panel. Scale bar represents 20 µm. A, anterior; L, lateral. (B, E) Representative response of single voxels during a tuning experiment. Stimulus epochs are shown in gray and direction of motion is indicated by arrows on the top. (C, F) Integral responses from (B) and (E) are shown in polar plot form. |

DS-RGC axons are diffusely distributed in the tectal neuropil of individual astray mutants (related to Figure 2). (A-D) Functional maps generated from single Tg(Isl2b:Gal4;UAS:SyGCaMP3) larvae showing the spatial distribution of DS-RGC subtypes in the tectal neuropil of WT larvae at 4 dpf (A) and 7 dpf (B), and astti272z larvae at 4 dpf (C) and 7 dpf (D). Four examples of WT and astti272z larvae are shown, respectively. Voxel brightness is proportional to the summed incidence of each functional subtype across all experiments 3 performed in each individual fish. Dashed lines indicate the position of the skin overlaying the tectum. Scale bar represents 20 ;;#181;m. A, anterior; L, lateral. |

DS-RGC axons are diffusely distributed in the tectal neuropil of individual astray mutants (related to Figure 2). (A-D) Functional maps generated from single Tg(Isl2b:Gal4;UAS:SyGCaMP3) larvae showing the spatial distribution of DS-RGC subtypes in the tectal neuropil of WT larvae at 4 dpf (A) and 7 dpf (B), and astti272z larvae at 4 dpf (C) and 7 dpf (D). Four examples of WT and astti272z larvae are shown, respectively. Voxel brightness is proportional to the summed incidence of each functional subtype across all experiments 3 performed in each individual fish. Dashed lines indicate the position of the skin overlaying the tectum. Scale bar represents 20 µm. A, anterior; L, lateral. |
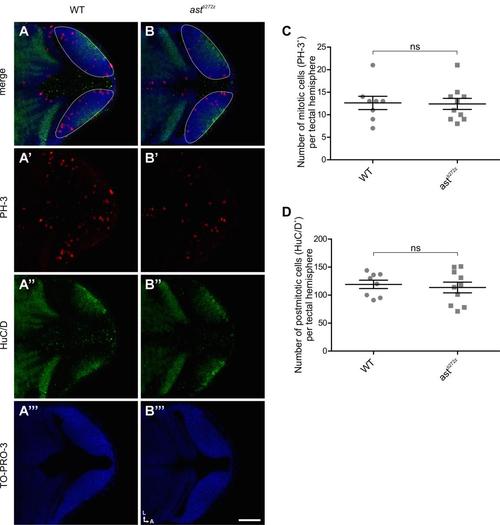
Tectal proliferation and differentiation are unaffected in astray mutants (related to Figure 3). Measurement of proliferation and differentiation in WT (n = 4) and astti272z (n = 5) larvae at 48 hpf. (A-B) Single confocal sections showing dorsal views of WT (A) and astti272z (B) embryos immunostained for PH-3 and HuC/D to mark mitotic and postmitotic cells, respectively. TO-PRO-3 was also used to stain cell nuclei. Dashed line outlines the border of each tectal hemisphere. Scale bar represents 50 µm. A, anterior; L, lateral. (C-D) Quantification of the degree of proliferation and differentiation in the tectum. For the number of mitotic cells (PH-3+) (C) 12.6 ± 1.4 for WT and 12.4 ± 1.2 for astti272z; for the number of post-mitotic cells (HuC/D+) (D) 119.1 ± 7.4 for WT and 113.6 ± 9.4 for astti272z. All graphs show mean values ± SEM. ns, not significant, unpaired t-test. |

Eye transplantations as a means to assess the cellular requirements for Robo2 in the functional development of DS tectal cells (related to Figure 6). (A) Schematic showing the experimental procedure followed. Optic vesicles from donor embryos were transplanted into hosts at 12-14 hpf and functional imaging was performed at 4 and 7 dpf. To confirm the success of each transplantation experiment, samples were fixed post-functional imaging at 7dpf and the donor and host eyes were bulk-loaded with the lipophilic dyes, DiI and DiD respectively, in order to label the entire retinotectal projection. (B-D) Three transplantation examples (one per transplantation group) showing the retinotectal projection of host and donor eyes. Scale bar represents 100 µm. A, anterior; L, lateral. (E) Schematic showing the experimental procedure followed to investigate the functional development of donor DS-RGC axons. Optic vesicles from ,em>Tg(Isl2b:Gal4;UAS:SyGCaMP3) donor embryos were transplanted into hosts at 12-14 hpf and functional imaging of donor RGC axons within the tectum was performed at 4 and 7 dpf. (F-G) Quantification of average number of DS-RGC voxels per group. Total number of DS-RGC voxels at 4 dpf (F), 697 ± 252.6 for WT-to-WT (n = 6 larvae, total of 18 optical sections), 1996 ± 689.9 for WT-to-astti272z (n = 5 larvae, total of 15 optical sections) and 544.3 ± 325.4 for astti272z-to-WT (n = 4 larvae, total of 12 optical sections). Total number of DS cells at 7 dpf (G), 1783 ± 870.9 for WT-to-WT (n = 8 larvae, total of 24 optical sections), 3606 ± 1190 for WT-to-astti272z (n = 4 larvae, total of 12 optical sections) and 1653 ± 692.9 for astti272z-to-WT (n = 5 larvae, total of 15 optical sections). All graphs show mean values ± SEM. ns, not significant, Kruskal-Wallis and Dunn′s multiple comparison tests. |