
- Title
-
Predominant Activation of JAK/STAT3 Pathway by Interleukin-6 Is Implicated in Hepatocarcinogenesis
- Authors
- Jung, I.H., Choi, J.H., Chung, Y.Y., Lim, G.L., Park, Y.N., Park, S.W.
- Source
- Full text @ Neoplasia

Transgenic strategy and specific expression of hIL6 gene in transgenic zebrafish. (A) Structure of the constructs used in the Tol2-mediated transgenesis. (B and C) Embryo images at 4 dpf (left, merged images) showed RFP expression in the liver. Hepatic expression of RFP and cardiac expression of GFP were used as the indicators to select the transgenic embryos under a fluorescence microscope. ISH for hIL6 (middle) at 4 dpf showed its RNA expression in the liver (black arrowhead). IHC at 6 weeks (right) showing the hIL6 expression at the hepatocytes only in Tg(LFABP:Gal4VP16;UAS:RFP;UAS:hIL6,Cmcl2:GFP). (D) A whole dissected viscera at 3 months showing the liver-specific expression of RFP. Dotted line indicates liver boundary. (E and F) Low-power images at 2 months. Note that the liver surface of the hIL6-expressing transgenic fish shows irregular contour due to inflammation. (G) H&E image of control liver at 6 weeks of age showing normal architecture with central vein at the center of image. (H–J) H&E images of the hIL6-expressing zebrafish showing the infiltration of inflammatory cells in the liver at 6 weeks of age. (H) Infiltration of the inflammatory cells was noted at a portal and a perivascular area (black and red arrowheads, respectively). Feathery degeneration (red arrow) is seen. (I) Inflammatory cells at hepatic sinusoids (black arrowhead). Pale to clear cytoplasm suggests ballooning degeneration of hepatocytes. (J) Inflammatory cells in an intrahepatic vessel (black arrowhead) are noted. Spotty necrosis (black arrows) and feathery degeneration (red arrow) are noted. (K–M) Three-month-old zebrafish. (K) Severe inflammation caused enlargement of spleen and adhesion to the liver (inset, control spleen). (L) Destructive change causing adhesion of liver, pancreas, intestine, and testis (inset, control pancreas). Swollen hepatocytes with pale cytoplasm indicate ballooning degeneration of the hepatocytes. (M) Inflammatory cell infiltration in the kidney (inset, control kidney showing hematopoietic cells between renal tubules). Ki, kidney; I, intestine; L, liver; Ov, Ovary; P, pancreas; SB, swim bladder; Sp, spleen; T, testis. Bars, 50 µm. |
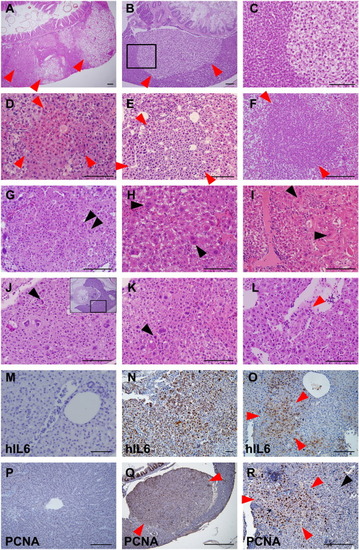
H&E staining of liver tumor progression in the transgenic zebrafish. (A–C) Two-month-old zebrafish. (D–I, M–R) Three-month-old zebrafish. (J–L) Six-month-old zebrafish. (M) and (P) are control liver images of Tg(LFABP:Gal4VP16; UAS:RFP), and others are from Tg(LFABP:Gal4VP16;UAS:RFP;UAS:hIL6,Cmcl2:GFP). All red arrowheads indicate dysplastic foci. (A) Multiple foci of hepatocellular alteration (red arrowheads). Clear cell change was most frequently observed. (B) Clear cell focus with scanty inflammation in the surrounding liver. (C) A high-power observation of the boxed area of (B) showing nuclear pleomorphism. (D) Eosinophilic focus of hepatocellular alteration. (E) Basophilic cell change showing cytological atypia with nuclear pleomorphism and high nucleocytoplasmic ratio. (F) Small cell change with increased cell density and high nucleocytoplasmic ratio. (G) Small cell change showing nuclear pleomorphism and occasional multinucleation (black arrowheads). (H) Large cell change with nuclear pleomorphism and frequent multinucleated cells (black arrowheads). (I) Dysplastic changes with eosinophilic mutilamellar structure (black arrowhead). (J–L) Overt HCCs showing marked nuclear and cytological pleomorphism of tumor cells at 6 (J) and 9 (K and L) months. (J) High-magnification view of boxed area of inset. Occasional mitoses are seen (black arrowheads). Occasionally, tumor cells invaded intrahepatic vessels, forming tumor thrombi (red arrowhead in L). (M–O) IHC against hIL6. Contrary to control liver (M), majority of the hepatocytes in M were found to highly express hIL6. (O) Hepatocytes in a dysplastic focus (red arrowhead) showing a robust expression of hIL6. (P–R) IHC against PCNA. (P) Control. (Q) PCNA expression was highly positive in the cells in the dysplastic nodule which appears as bulging mass (red arrowheads). (R) The hepatocytes at dysplastic focus (red arrowheads) showed more frequent positivity to PCNA expression than the ones at nondysplastic area (black arrowhead). Bars, 50 µm. |
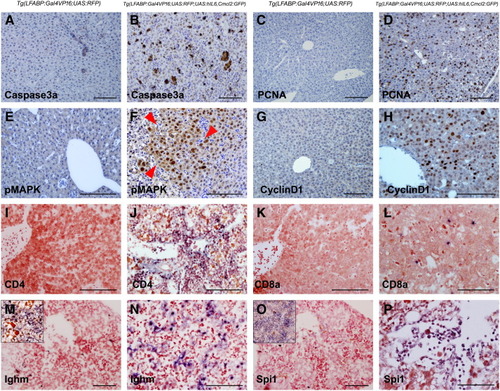
hIL6-induced chronic inflammation, cell death, and enhanced proliferation. All images were obtained from 3-month-old zebrafish. (A, C, E, G, I, K, M, and O) Controls. (B) IHC against active caspase 3a showing the positive hepatocytes in the hIL6-expressing liver. (D, F, and H) IHC against proliferation markers PCNA, pMAPK, and cyclin D1, respectively. Note that even the hIL6-expressing liver with nondysplastic foci (D and H) showed marked increase of the marker expression. A dysplastic focus in (F) (red arrowheads) shows a robust positivity for pMAPK. (I–P) ISH for leukocyte markers CD4, CD8a, Ighm, and Spi1. Insets in (M) and (O) indicate zebrafish spleen used as internal control. Majority of the infiltrated T cells are CD4-positive helper T cells. The infiltrated inflammatory cells are located at the portal tract, sinusoids, and intrahepatic vessels. Bars, 50 µm. |
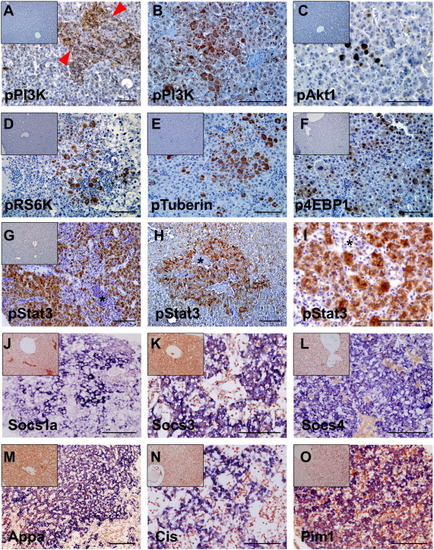
IHC and ISH experiments for the molecular components involved in the hIL6-mediated PI3K/Akt and JAK/STAT3 pathways. (A and B, D–H, and J–O) Three-month-old zebrafish. (C and I) Six-month-old zebrafish. (A, H, and L) Inset images are controls. (B–G and I–K) IHC images. (M–P) ISH images. (A and B) IHC against pPI3K. (A) Activated PI3K expression was confined to the infiltrating inflammatory cells in portal area (red arrowheads). (B) Most of the dysplastic foci were negative to the pPI3K except for the hepatocytes with large cell changes. (C–F) IHC for downstream components of the PI3K/Akt pathway. Like the pPI3K expression, expression of the components was restricted to the hepatocytes with large cell change. (G-I) IHC against pSTAT3. Virtually all of the hepatocytes expressing hIL6 were reactive to pSTAT3. (H and I) Robust pSTAT3 expression is seen in a dysplastic focus and HCC, respectively. Note that, contrary to the pPI3K, the infiltrating inflammatory cells (*) contain negative expression of the pSTAT3. (J–O) ISH for the downstream genes induced by active JAK/STAT3 signaling. Expression of the genes was notably strong in the dysplastic foci. Bars, 50 µm. |
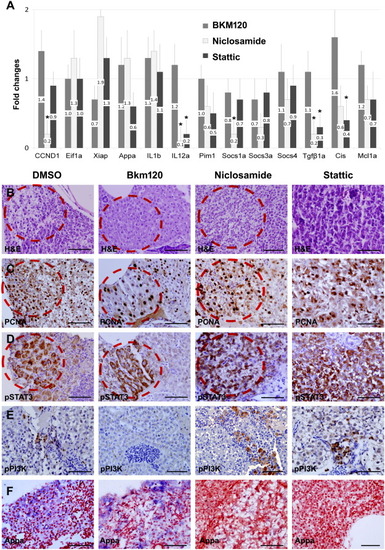
Drug inhibition assay on IL6 signaling pathway. (A) Real-time RT-PCR after inhibitor treatment (PI3K inhibitor BKM120 and STAT3 inhibitors Niclosamide and Stattic). Graphs are shown with mean values and standard error bars. The STAT3 inhibitors showed the decreased expression of the downstream components in the JAK/STAT3 pathway. No significant downregulation of the genes in the PI3K/Akt pathway was observed. The asterisk indicates the significant difference between the inhibitor-treated group and the control as determined by Mann-Whitney U test (P < .05). (B) H&E images. (C–E) IHC for PCNA, pSTAT3, and pPI3K after the drug treatment. BKM120 treatment showed downregulation of the pPI3K expression. pSTAT3 expression, however, was not completely suppressed by STAT3 inhibitor treatment. Note that pSTAT3 and PCNA were heavily expressed in the same dysplastic area of serial sections (red circles, sections from the same liver tissue). (F) ISH for Appa showing downregulation by STAT3 inhibitors. Bars, 50 µm. |
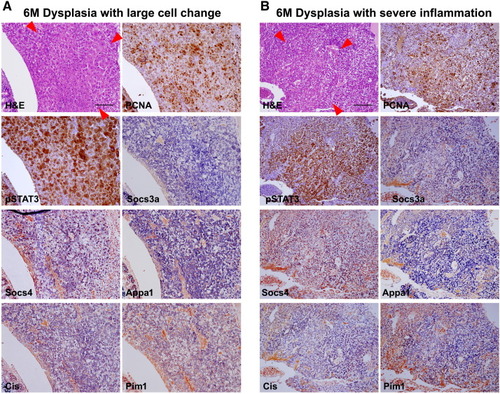
Activation of JAK/STAT3 pathway in serial sections. Red arrowheads indicate boundary of dysplastic foci. (A) Dysplasia with large cell changes. PCNA expression correlated with pStat3 expression. Inflammatory genes activated by JAK/STAT3 pathway are also expressed. (B) Dysplasia with inflammatory changes. Enhanced proliferation measured by PCNA expression precisely correlates with pStat3 expression. Downstream genes are also activated. |
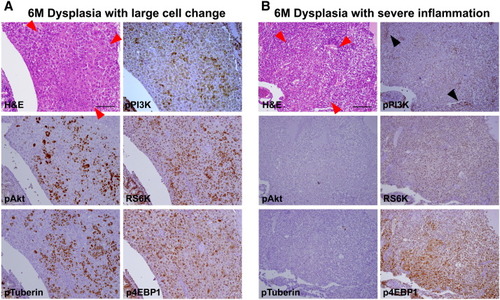
Activation of PI3K pathway in serial sections (same sections with Supplementary Figure 1). (A) Dysplasia with large cell changes showing expression of active components of PI3K pathway. (B) Dysplasia with robust inflammation. Contrary to (A), pPI3K expression is noted in inflammatory cells (black arrowheads) with faint patch expression in hepatocytes. Downstream components of PI3K pathway are not activated, showing nil pAkt, RS6k, or pTuberin expression but p4EBP1 expression. |