
|
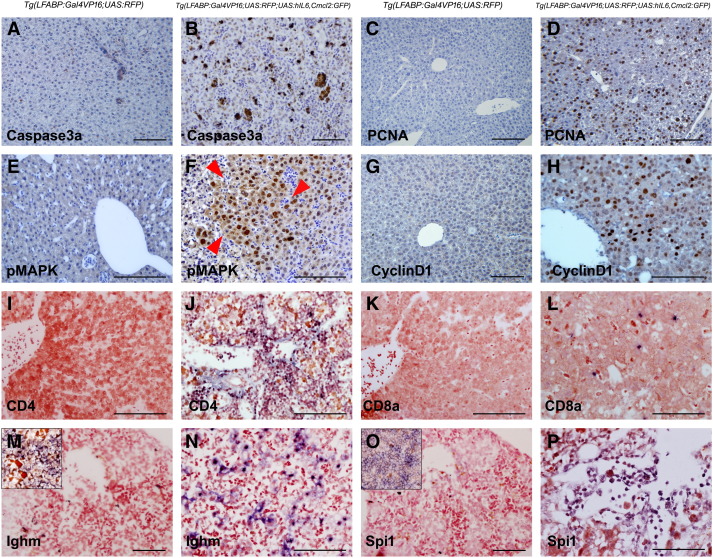
Fig. 4
hIL6-induced chronic inflammation, cell death, and enhanced proliferation. All images were obtained from 3-month-old zebrafish. (A, C, E, G, I, K, M, and O) Controls. (B) IHC against active caspase 3a showing the positive hepatocytes in the hIL6-expressing liver. (D, F, and H) IHC against proliferation markers PCNA, pMAPK, and cyclin D1, respectively. Note that even the hIL6-expressing liver with nondysplastic foci (D and H) showed marked increase of the marker expression. A dysplastic focus in (F) (red arrowheads) shows a robust positivity for pMAPK. (I–P) ISH for leukocyte markers CD4, CD8a, Ighm, and Spi1. Insets in (M) and (O) indicate zebrafish spleen used as internal control. Majority of the infiltrated T cells are CD4-positive helper T cells. The infiltrated inflammatory cells are located at the portal tract, sinusoids, and intrahepatic vessels. Bars, 50 µm.