
- Title
-
Pharmacological Characterization of an Antisense Knockdown Zebrafish Model of Dravet Syndrome: Inhibition of Epileptic Seizures by the Serotonin Agonist Fenfluramine
- Authors
- Zhang, Y., Kecskés, A., Copmans, D., Langlois, M., Crawford, A.D., Ceulemans, B., Lagae, L., de Witte, P.A., Esguerra, C.V.
- Source
- Full text @ PLoS One
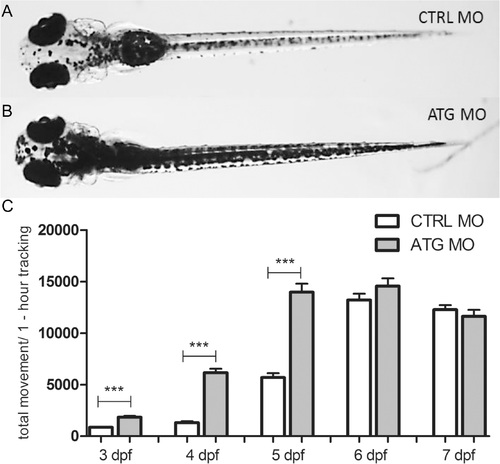
Morphology and larval locomotor activity of scn1Lab ATG morphants. (A) Dorsal view of a representative 5 dpf CTRL MO-injected larva. (B) Dorsal view of a representative 5 dpf ATG MO-injected larva. (C) The y-axis depicts the total larval locomotor activity of ATG MO- compared to CTRL MO-injected larvae over a one-hour tracking experiment (30-minute integration time). Data were pooled from three independent experiments with 12 larvae per injection condition. Statistical analysis was performed using Mann-Whitney test. Error bars on all graphs represent the standard error of mean (SEM). *** P d 0.001. PHENOTYPE:
|
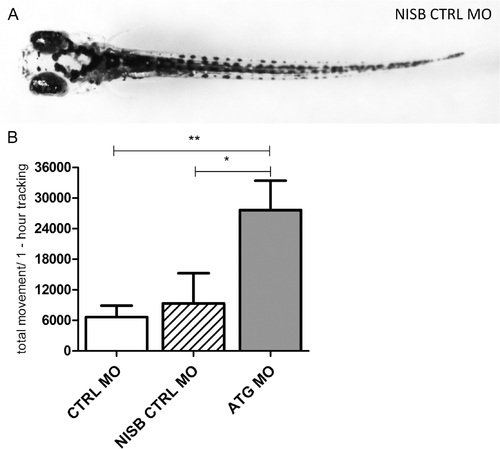
Morphology and larval locomotor activity of scn1Lab ATG morphants in comparison to control larvae with non-inflated swim bladder. (A) Dorsal view of a representative 5-dpf CTRL MO-injected larva with non-inflated swim bladder (NISB CTRL MO). (B) The y-axis depicts the total larval locomotor activity of ATG MO- compared to CTRL MO-injected larvae and CTRL MO-injected larvae win non-inflated swim bladder (NISB CTRL MO) over a one-hour tracking experiment (30-minute integration time). Data were analyzed from one experiment with 8–12 larvae per injection condition. Statistical analysis was performed using Dunnett′s multiple comparisons test. Error bars on all graphs represent standard error of mean (SEM). * P d 0.05, ** P d 0.01. |
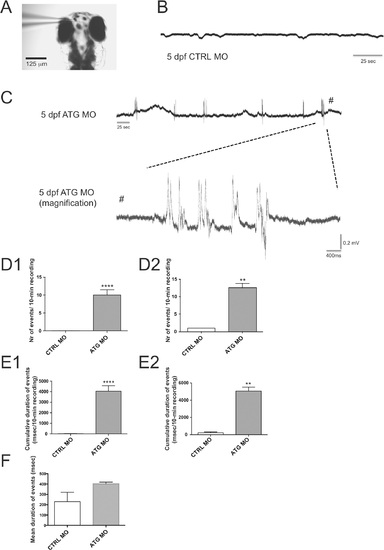
Spontaneous electrographic activity recorded from 5 dpf ATG MO- and CTRL MO-injected larvae. (A) Representative recording configuration of an agar-immobilized zebrafish at 5 dpf. Note the recording electrode placed in the forebrain. (B) Extracellular recordings from the forebrain of 5 dpf CTRL-MO larvae. (C) Representative epileptiform activities of 5 dpf ATG MO-injected larvae displaying polyspiking discharges. Top trace represents a typical epileptiform pattern as seen in gap-free recordings. Bottom trace shows high-resolution magnification of epileptiform events mentioned above. (D) Occurrence of epileptiform events in CTRL MO- and ATG MO-injected larvae. (D1) All larvae: CTRL MO 0.07±0.05 vs ATG MO 10.03±1.38 events/recording (n = 28 and 30 larvae, respectively). (D2) Seizure-positive larvae: CTRL MO 1.0±0.0 vs ATG MO 12.54±1.27 events/recording (n = 2 and 24 larvae, 2 and 302 events analyzed, respectively). (E) Cumulative duration of epileptiform events in CTRL MO- and ATG MO-injected larvae. (E1) All larvae: CTRL MO 16.4±12.3 vs ATG MO 4053±515 msec/10 min-recording (n = 28 and 30 larvae, respectively). (E2) Seizure-positive larvae: CTRL MO 290±91 vs ATG MO 5066±441 events/recording (n = 2 and 24 larvae, respectively). (F) Mean duration of electrographic activity recorded from 5 dpf CTRL MO- and ATG MO-injected larvae. ATG MO, 402.6±16.4 vs CTRL MO 230±91 msec (n = 302 and 2 events from 30 and 2 larvae, respectively, P = 0.3929). Statistical analysis was performed using Student’s unpaired t-test or Mann–Whitney test for data that failed the normality test, as appropriate. Error bars on all graphs represent standard error of mean (SEM). ** P d 0.01, **** Pd0.0001. PHENOTYPE:
|
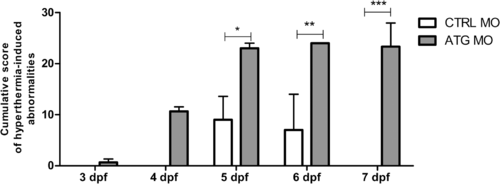
Confirmation of hyperthermia-induced abnormalities. The y-axis depicts the cumulative score to quantify the severity of hyperthermia-induced abnormalities 24 hours after heatshock. Normal behavior was scored as 0, decreased touch response and partial loss of posture as 1, absent touch response and complete loss of posture as 2, and death as 3. The number of larvae was multiplied by the value corresponding to the level of severity. The x-axis corresponds to CTRL MO- and ATG MO-injected larvae from 3 dpf to 7 dpf (day of heatshock). Data of graphs are pooled together from three independent experiments with 8 larvae per condition. Statistical analysis was performed using two-way ANOVA with Bonferroni post-tests. Error bars on all graphs represent standard error of mean (SEM). * P ≤ 0.05, ** P ≤ 0.01, *** P≤0.001. |

ZFIN is incorporating published figure images and captions as part of an ongoing project. Figures from some publications have not yet been curated, or are not available for display because of copyright restrictions. PHENOTYPE:
|
|
ZFIN is incorporating published figure images and captions as part of an ongoing project. Figures from some publications have not yet been curated, or are not available for display because of copyright restrictions. PHENOTYPE:
|