
- Title
-
Genetic depletion and pharmacological targeting of αv integrin in breast cancer cells impairs metastasis in zebrafish and mouse xenograft models
- Authors
- Li, Y., Drabsch, Y., Pujuguet, P., Ren, J., van Laar, T., Zhang, L., van Dam, H., Clément-Lacroix, P., Ten Dijke, P.
- Source
- Full text @ Breast Cancer Res.
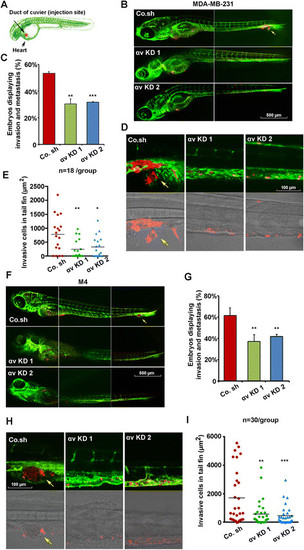
Integrin αv is required for tumor cell invasion and metastasis in xenografted zebrafish. (A) Schematic diagram of the zebrafish embryo xenograft model. (B) mCherry-labeled MDA-MB-231 cells infected with control shRNA (Co. sh) or αv integrin knockdown shRNAs (KD 1 and KD 2) were injected into zebrafish at 48 hours post fertilization (hpf). Confocal images were made 6 days post implantion (dpi). Arrows indicate invasive tumor cells, scale bar: 500 µm. (C) Percentage of embryos displaying invasion and metastasis detected at day 6 post injection. Data ± SD are representative of three independent experiments (each, n >50). Control versus αv KD 1 P <0.01; control versus αv KD 2 P <0.001. (D) High-resolution images of tumor cells in the posterior tail fin (upper panel, fluorescence; lower panel, transmitted). Arrows indicate invasive tumor cells, scale bar: 100 µm. (E) Area of invasive cells in each embryo (n = 18). Control versus αv KD 1 P <0.01; control versus αv integrin KD 2 P <0.05. (F) Invasion and metastasis in zebrafish xenografted with control or αv integrin knocked-down MCF10A-M4 cells at 6 dpi. Arrows indicate invasive tumor cells, scale bar: 500 µm. (G) Percentage of embryos displaying invasion and metastasis detected at day 6 post-injection. Control versus αv KD 1 P <0.01; control versus αv KD 2 P <0.01. (H) High-resolution images of tumor cells in the posterior tail fin (upper panel, fluorescence; lower panel, transmitted). Arrows indicate invasive tumor cells, scale bar: 100 µm. (I) Area of metastatic clusters in each embryo (n = 30). Control versus αv KD 1 P <0.01; control versus αv KD 2 P <0.001. EXPRESSION / LABELING:
|
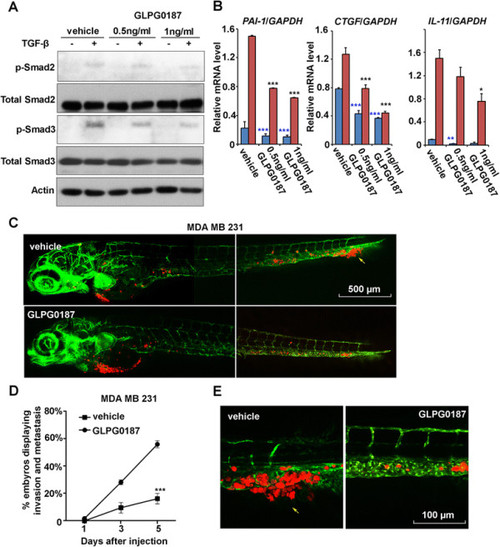
GLPG0187 suppresses breast tumor invasion and metastasis in zebrafish. (A) MDA-MB-231 cells were treated with vehicle, 0.5 ng/ml or 1 ng/ml of GLPG0187 for 48 h with or without 5 ng/ml transforming growth factor (TGF)-β for 2 h and immunoblotted as shown. (B) MDA-MB-231 cells were treated with vehicle, 0.5 ng/ml or 1 ng/ml of GLPG0187 for 48 h with or without 5 ng/ml TGF-β for 6 h and subjected to quantitative PCR analysis. mRNA levels of PAI-1, CTGF, and IL-11 were normalized to GAPDH expression. (C) MDA-MB-231 cells were pretreated for 6 h with 1 ng/ml GLPG0187 or vehicle, then injected into the blood circulation of zebrafish 48-h post fertilization and followed with or without 0.5 ng/ml GLPG0187 treatment, as indicated. Confocal images of overview zebrafish were made 5 days post implantion (dpi). Arrows indicate invasive tumor cells, scale bar: 500 µm. (D) Percentage of embryos displaying invasion and metastasis at 1, 3, and 5 dpi is shown; vehicle versus GLPG0187 P <0.001. (E) Representative images of the zebrafish described in panel D. Experimental micrometastasis was detected in the posterior tail fin at 5 dpi. Arrows indicate invasive tumor cells, scale bar: 100 µm. EXPRESSION / LABELING:
|