
- Title
-
Sufficient Numbers of Early Germ Cells Are Essential for Female Sex Development in Zebrafish
- Authors
- Dai, X., Jin, X., Chen, X., He, J., Yin, Z.
- Source
- Full text @ PLoS One
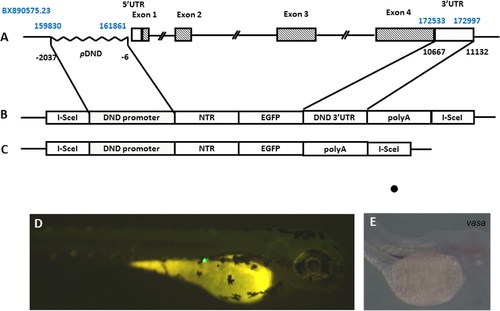
Generation of the transgenic zebrafish with the NTR-EGFP expression under the control of zebrafish dnd promoter. A) genomic structure of zebrafish dnd gene, including 5′UTR region, 4 exons and 3′ UTR region identified for its PGC-specific presence in the fourth exon. The positions for the region in zebrafish DNA sequence BX890575.23 are labeled in blue. The position sites for the region used related to the transcriptional starting site of dnd are labeled in black. B) schematic representation of the transgenic construct containing the 5′-dnd:ntr-egfp-3′UTR of dnd-3′ fragment flanked by I-Sce1 sites. C) Schematic representation of the transgenic construct containing the 5′-dnd:ntr-egfp without dnd-3′ fragment flanked by I-Sce1 sites. D) Fluorescence microscopic image showing EGFP-expressing PGCs of a F0 progeny at 72 hpf. E) in situ hybridization signals of vasa probe showing the position of PGC at 72 dpf. |
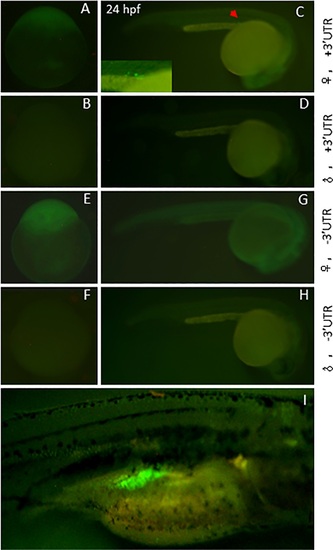
Germ line expression of the dnd+3′UTR:NTR-EGFP and dnd-3′UTR:NTR-EGFP transgene in zebrafish. The fluorescent protein expression was monitored using fluorescence microscopy. A-D) Expression pattern of the transgene in dnd+3′UTR:NTR-EGFP transgenic fish. A and C, the expression pattern following female transmission, with PGC-specific expression at 24 hpf stage (the inset in C shows the EGFP-positive PGCs in transgenic embryos); B and D, no fluorescence expression following male transmission. E-H) Expression pattern of the transgene in dnd-3′UTR: NTR-EGFP transgenic fish. E and G, the expression pattern following female transmission, without PGC-specific expression at 24 hpf stage (G); F and H, no fluorescence expression following male transmission either. I) early germ cell-specific expression patterns of transgene at 18 dpf in both dnd+3′UTR:NTR-EGFP or dnd-3′UTR: NTR-EGFP transgenic fish, following either female or male transmission. |
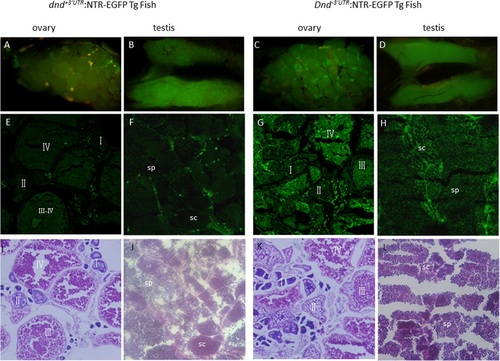
Gonadal expression of the dnd+3’UTR:NTR-EGFP and dnd-3’UTR:NTR-EGFP transgene in adult zebrafish. Anatomical views of the gonadal expression of the NTR-EGFP transgene are presented in A-D; Views of NTR-EGFP trangene expression and histological features with HE staining in the cyosectioned gonadal tissue are presented in E-H and I-L; A and B) Expression of the transgene in zebrafish ovary (A) and testis (B) in dnd+3’UTR:NTR-EGFP transgenic fish at 100 dpf; C and D) Expression of the transgene in zebrafish ovary (C) and testis (D) in dnd-3’UTR:NTR-EGFP transgenic fish at 100 dpf; E and F) NTR-EGFP transgene expression in the cryosections of the ovary (E) and testis (F) of the F1 progenies of dnd+3’UTR:NTR-EGFP transgenic fish at 100 dpf; G and H) NTR-EGFP transgene expression in the cryosections of the ovary (G) and testis (H) of the F1 progenies of dnd-3’UTR:NTR-EGFP transgenic fish at 100 dpf; I-J) histological features with HE staining for the I-J) shows the HE staining for the cryosections of the ovary (I) and testis (J) of the F1 progenies of dnd+3’UTR:NTR-EGFP transgenic fish at 100 dpf; K-L) shows the HE staining for the cryosections of the ovary (K) and testis (L) of the F1 progenies of dnd-3’UTR:NTR-EGFP transgenic fish at 100 dpf; Fluorescence was observed in the oocytes at all stages (E, G, I, K) and in spermatocytes(sc) and sperm(sp) (F, H, J, L). |
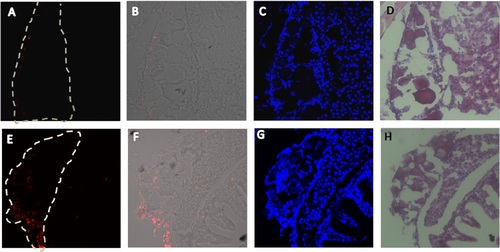
Induced cell death in transition gonads of the dnd:NTR-EGFP transgenic fish via MTZ treatments. The MTZ-induced cell death were evaluated by an in situ cell death assay in the transition gonads of the dnd:NTR-EGFP transgenic fish at 26 dpf stage after 1 week MTZ treatment. Transgenic fish at 18 dpf were treated with 5 mM MTZ/0.2% DMSO or 0.2% DMSO solution for 1 week. The fish were cryosectioned at 6µm for in situ TUNEL assay. A-D) transition gonad after MTZ treatments with apoptosis signals under fluorescent microscope (red fluorescence, A), merge images under fluorescent microscope and white light microscope (B), DAPI staining (C), HE staining (D); E-H) transition gonad in control groups with apoptosis signals under fluorescent microscope (red fluorescence, E), merge images under fluorescent microscope and white light microscope (F), DAPI staining (G), HE staining (H); The white frame indicates the gonad position. |