
- Title
-
Loss of wwox expression in zebrafish embryos causes edema and alters Ca(2+) dynamics
- Authors
- Tsuruwaka, Y., Konishi, M., Shimada, E.
- Source
- Full text @ Peer J.
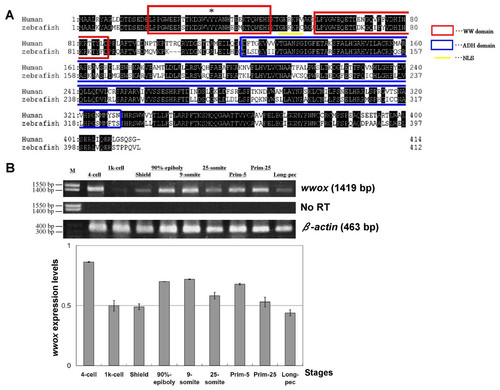
Alignment of human and zebrafish WWOX amino acid sequences, and expression of zebrafish wwox using RT-PCR. (A) Human and zebrafish WWOX amino acid sequence alignments Human WWOX (accession no. AF187014), zebrafish wwox (accession no. BC044560), the WW domain (amino acids 18–47 and 59–87, circled with red boxes), the NLS (amino acids 50–55, underlined), the ADH domain (amino acids 121–330, circled with a blue box) and Tyr33 (*) are shown. (B) Expression of zebrafish wwox at various developmental stages was determined using RT-PCR and gel image analyses were normalized to β-actin expression (accession no. AF057040.1). Data are presented as means ± SEM; M, marker; No RT, RT-PCR reaction without reverse transcriptase. |
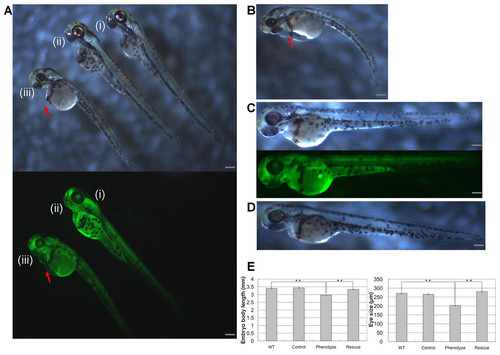
Knockdown of wwox induced pericardial edema and reduced eye formation in embryos during the long-pec stage at 48 h post fertilization. Arrows indicate edema; (A) Upper, A bright-field image of a (i) wild-type embryo; (ii) wwox negative-control MO-injected embryo; and (iii) wwox MO-injected embryo; Lower, fluorescence image of the upper panel. (B) A wwox siRNA-injected embryo. (C) A wwox rescued MO-injected embryo (upper, bright-field image; lower, fluorescence image). (D) A wwox rescued siRNA-injected embryo. (E) Quantification of body lengths and eye sizes of long-pec embryos; 30 embryos were examined in three independent experiments and data are expressed as means ± SEM (∗∗p < 0.01); WT, wildtype; Scale bars, 250 µm. PHENOTYPE:
|
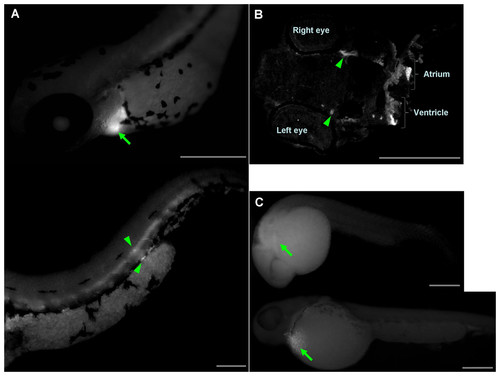
Determination of wwox expression in developing zebrafish hearts using fluorescent whole-mount in situ hybridization. (A) Lateral view of the heart (upper) and tail (lower) of the embryo at the long-pec stage; Arrow, ventricle; arrow heads, putative digestive organs. (B) A cardiac tissue section of the long-pec embryo; Arrow heads show optic nerves. (C) Lateral view of embryos at prim-5 (upper) and prim-25 (lower); Arrows indicate putative ventricles; Scale bars, 250 µm. |
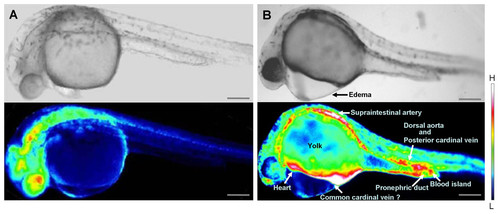
Comparison of intracellular Ca2+ dynamics in prim-15 stage (30 hpf) embryos. Upper, bright field image; lower, color-coded image; (A) wildtype; (B) wwox knockdown produced edema formation and induced altered Ca2+ dynamics; Scale bars, 250 µm. The color-coded image shows Ca2+ levels as white (high Ca2+) and blue (low Ca2+). PHENOTYPE:
|