
- Title
-
Myc-Induced Liver Tumors in Transgenic Zebrafish Can Regress in tp53 Null Mutation
- Authors
- Sun, L., Nguyen, A.T., Spitsbergen, J.M., Gong, Z.
- Source
- Full text @ PLoS One
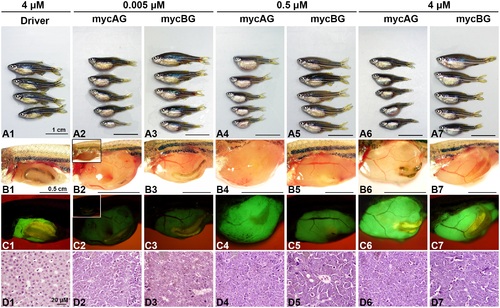
Liver tumor progression in mycAG and mycBG fish. MycAG fish and mycBG fish were induced with mifepristone of increasing concentrations, as indicated at the top of the figure, from 1 mpf and sacrificed at 2 mpi (3 mpf). (A1–A7) Exterior observation of fish from each treatment group. (B1–B7) Gross observation of liver tumors after removal of abdominal wall. (C1 to C7) The same views as those in (B1–B7) for observation of GFP expression that illustrate the shape of livers. In B2 and C2, images from uninduced mycAG fish are included as insets for comparison and there were no enlarged liver (B2) and no visible GFP expression in the liver although green fluorescent signals was observed in the gut in some fish (C2). (D1–D7) H&E staining of liver sections. |
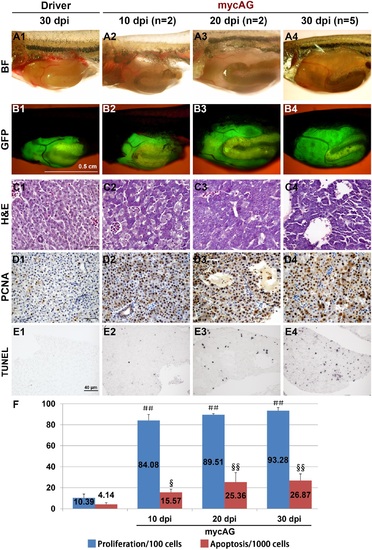
Rapid induction of live tumors by induced mycAG expression. MycAG fish were induced with 2 µM mifepristone from 1 mpf and sampled at 10, 20 and 30 dpi for gross observation as indicated in the figure. (A1-A4) Gross observation of liver tumors after removal of abdominal wall. (B1-B4) The same views as those in (A1-A4) for observation of GFP expression that illustrate the shape of livers. (C1-C4) H&E staining to show cellular alteration in the fish liver. (D1-D4) PCNA staining by immunocytochemistry to show cell proliferation. (E1-E4) TUNEL assay to reveal the apoptosis in the liver. (F) Quantitative analyses of cell proliferation and apoptosis. indicates highly significant difference (P<0.01) in proliferation when compared that in the Driver control at 30 dpi; § and §§, indicate significant (P<0.05) and highly significant (P<0.01) difference respectively in apoptosis when compared to that in the Driver control at 30 dpi. |
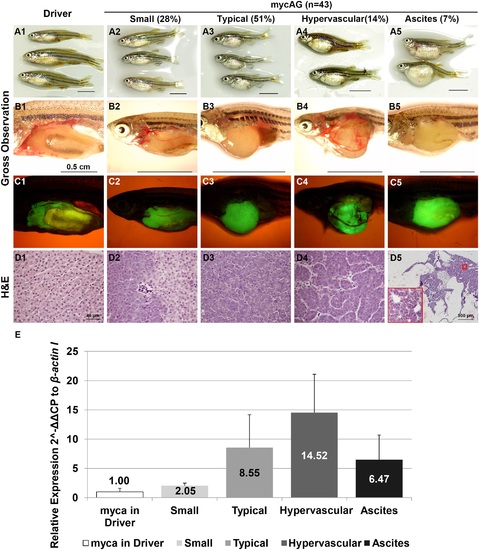
Diverse liver tumor phenotypes of mycAG zebrafish at 6 mpi. MycAG fish were induced by 2 µM mifepristone from 1 mpf and sampled at 7 mpf (6 mpi) for gross observation and histological examination. Four phenotypes were observed: Small, Typical, Hypervascular and Ascites, as indicated at the top of the figure with total numbers and percentages. (A1–A5) Exterior observation of each phenotype. (B1–B5) Gross observation of liver tumors after removal of body wall. (C1 to C5) The same views as those in (B1–B5) for observation of GFP expression that illustrate the shape of livers. (D1–D5) H&E staining of liver sections. (D1–D4) have the same magnification as indicated in scale bar in (D1). The scale bar in (D1) represents magnification for all of (D1–D4) and blow-up area in (D5). (E) Transgenic mycAG expression in each phenotype. Transgenic mycAG expression in the liver was measured by RT-qPCR and the level of expression was relative to baseline myca expression in the control Driver fish. |
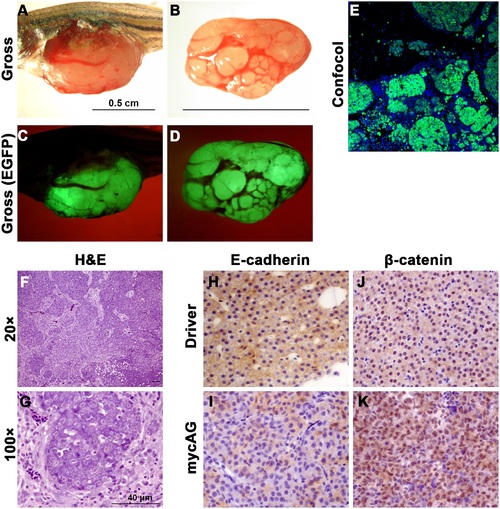
Development of multinodular HCC in late stage of mifepristone induction. MycAG fish were induced by 2 µM mifepristone from 1 mpf and sampled at 9 mpf (8 mpi) for gross observation, histological examination and immunocytochemistry. (A–D) Gross observation of multinodular HCC in two examples of mycAG fish in both bright field and GFP channel. (E) Confocal microscope image to show GFP positive hepatocytes and GFP negative cirrhosis stroma. (F,G) H&E staining of multinodular HCC sections with two different magnifications. (H,I) Immunocytochemical staining of E-cadherin in liver sections from a Driver fish (H) and a mycAG fish (I). (J,K) Immunocytochemical staining of β-catenin in liver sections from a Driver fish (J) and a mycAG fish (K). |
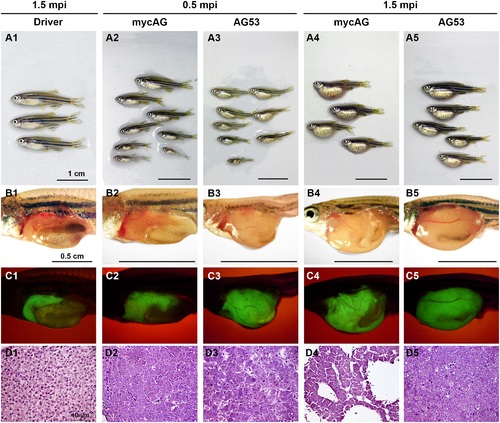
Accelerated liver tumor progression of mycAG fish in homozygous tp53M214K background (AG53). MycAG and AG53 fish were induced by 2 µM mifepristone from 1 mpf and sampled at 0.5 mpi and 1.5 mpi for gross observation and histological examination, as indicated at the top of the figure. (A1–A5) Exterior observation of each phenotype. (B1–B5) Gross observation of liver tumors after removal of body wall. (C1 to C5) The same views as those in (B1–B5) for observation of GFP expression that illustrate the shape of livers. (D1–D5) H&E staining of liver sections. |
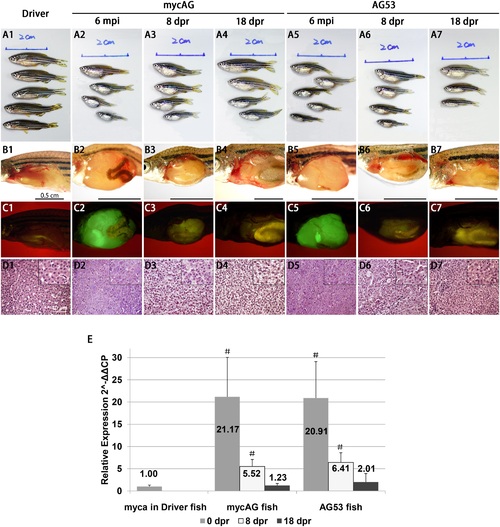
Tumor regression in mycAG fish and AG53 fish after mifepristone withdrawal. Mifepristone was withdrawn at 6 mpi (7 mpf), MycAG line and AG53 fish were sampled at 0 dpr, 8 dpr and 18 dpr for gross observation and histological examination, (A1–A7) Exterior observation of each phenotype. (B1–B7) Gross observation of liver tumors after removal of abdominal wall. (C1–C7) The same views as those in (B1–B5) for observation of GFP expression that illustrate the shape of livers. (D1–D7) H&E staining of liver sections. Larger magnifications are shown in insets. (E) MycAG mRNA level in 0-dpr, 8-dpr and 18-dpr liver samples as quantified by RT-qPCR. Each group had three biological replicates. # indicates significant difference (P<0.05) when compared with myca expression in the Driver. |
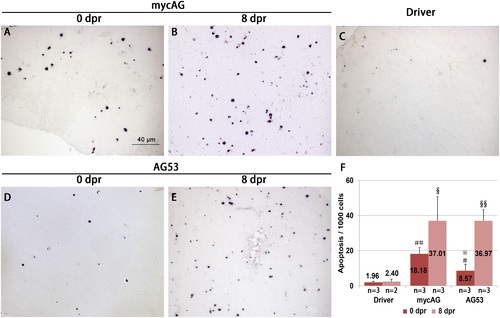
Increase of apoptosis after mifepristone withdrawal. MycAG line and AG53 fish were induced by 2 µM mifepristone from 1 mpf and mifepristone was removed after 6 month induction for tumor regression. These fish were then collected for TUNEL assay. (A–E) TUNEL assay for apoptosis on liver sections from different types of fish at different time points as indicated. dpr, day post regression. (F) Quantification of apoptotic cells in liver sectons. and indicate significant difference with p-values of 0.05 and 0.01 respectively when compared to Driver at 0 dpr. § and §§ indicate significant difference with p-values of 0.05 and 0.01 respectively when compared to Driver at 8 dpr. * indicates significant difference (P<0.05) when compared with AG at 0 dpr. PHENOTYPE:
|
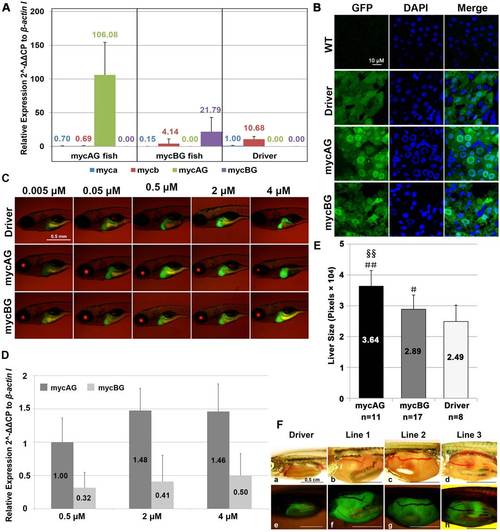
Effects of mycAG and mycBG expression in zebrafish liver. (A) Expression of transgenic mycAG and mycBG in comparison with expression of endogenous myca and mycb genes. Liver RNA from 1 mpi (2 mpf) fish treated with 2 µM mifepristone were analysed by RT-qPCR and expression values are relative to the level of endogenous myca mRNA, which is arbitrarily set as 1. (B) Subcellular localization of mycAG and mycBG fusion proteins. Fish were all treated with 2 µM mifepristone and liver tissues were collected at 1 mpi (2 mpf) for cryosection. GFP signal was recorded by confocal microscope with the same exposure time. Nuclei were stained by DAPI and recorded in the blue channel. Wild type liver was used as a negative control. (C) Dosage-dependent effect of mifepristone induction on GFP or Myc-GFP expression and liver size in Driver, mycAG and mycBG larvae. These transgenic fish were induced with mifepristone at different concentrations from 3 dpf and photographed at 8 dpi (5 dpi). (D) Dosage-dependent increase of mycAG and mycBG expression as measured by RT-qPCR. (E) Quantification of liver size based on 2D images at 4 µM mifepristone. Size of liver of larvae was measured according to GFP signal area. # and ## indicate significant difference with p-values of 0.05 and 0.01 respectively when compared with the liver size in the Driver. (F) Induction of liver tumors from other mycAG transgenic families. Representative fish from three other mycAG transgenic families are shown with gross observations of liver tumors (upper panels) and GFP expression (lower panels) to illustrate the liver tissues as described in Fig. 1B and 1C. |
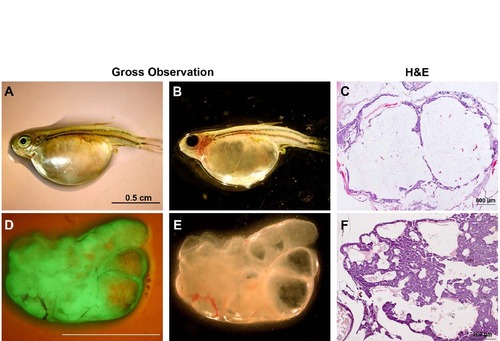
Ascites in mycAG zebrafish. MycAG fish were induced by 2 µM mifepristone from 1 mpf and sampled at 7 mpf (6 mpi) for gross observation and histological examination. (A) Gross observation of the mycAG fish with ascites phenotype in monotone background. (B) Gross observation of the same fish in (A) under a dark background to show transparent belly. (C) H&E staining of the fish presented in (A,B). (D, E) Isolated liver tumor from another mycAG fish with ascites for GFP view (D) and for view in a dark background to show transparent, foam-like structure (E). Liquid was observed in cysts in the liver. (F) H&E staining of the liver tumor presented in (C,D). |
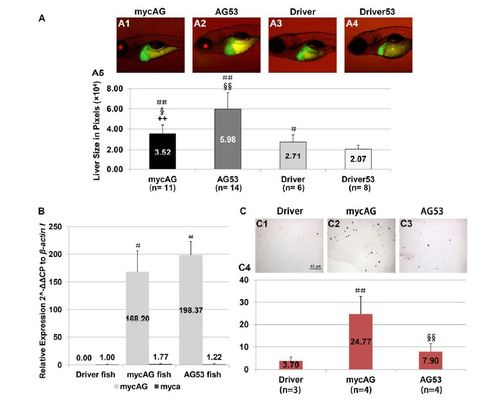
Reduction of apoptosis and acceleration of liver tumor progression in mifepristone-induced mycAG fish with tp53M214K mutation (AG50). (A) Comparison of liver size between mycAG and AG53 larvae. Larvae were induced with 2 µM mifepristone from 3 dpf and photographed at 5 dpi (8 dpf). Liver size was measured based on 2D GFP images as previously described [35]. ## and # indicate significant difference with p-values of 0.01 and 0.05 respectively when compared with the liver size in the Driver53 (Driver fish in tp53M214K mutation background). §§ and § indicate significant difference with p-values of 0.01 and 0.05 respectively when compared with the liver size in the Driver. ++ indicates significant difference (P < 0.01) when compared with the liver size in AG53. (B) Induction of mycAG expression in mycAG and AG53 fish. Total RNA was extracted from 5 dpi/8 dpf larvae treated with 2 µM mifepristone for RT-qPCR analyses. Each group has three biological replicates and there was no significant effect on induction of mycAG mRNA by tp53M214K mutation. # indicates the expression differences when compared to endogenous myca expression in Driver fish (p < 0.05). (C) Apoptosis in AG53 and mycAG fish livers. Liver sections from 2 mpi (3 mpf) driver, mycAg and AG50 fish were used for TUNEL staining. Each group has 3 to 4 biological replicates and apoptosis was counted and represented in column. , indicates the difference in proliferation when compared with Driver is significant (P < 0.01). §§ indicates significant difference between mycAG and AG50 fish (P < 0.01). |