
|
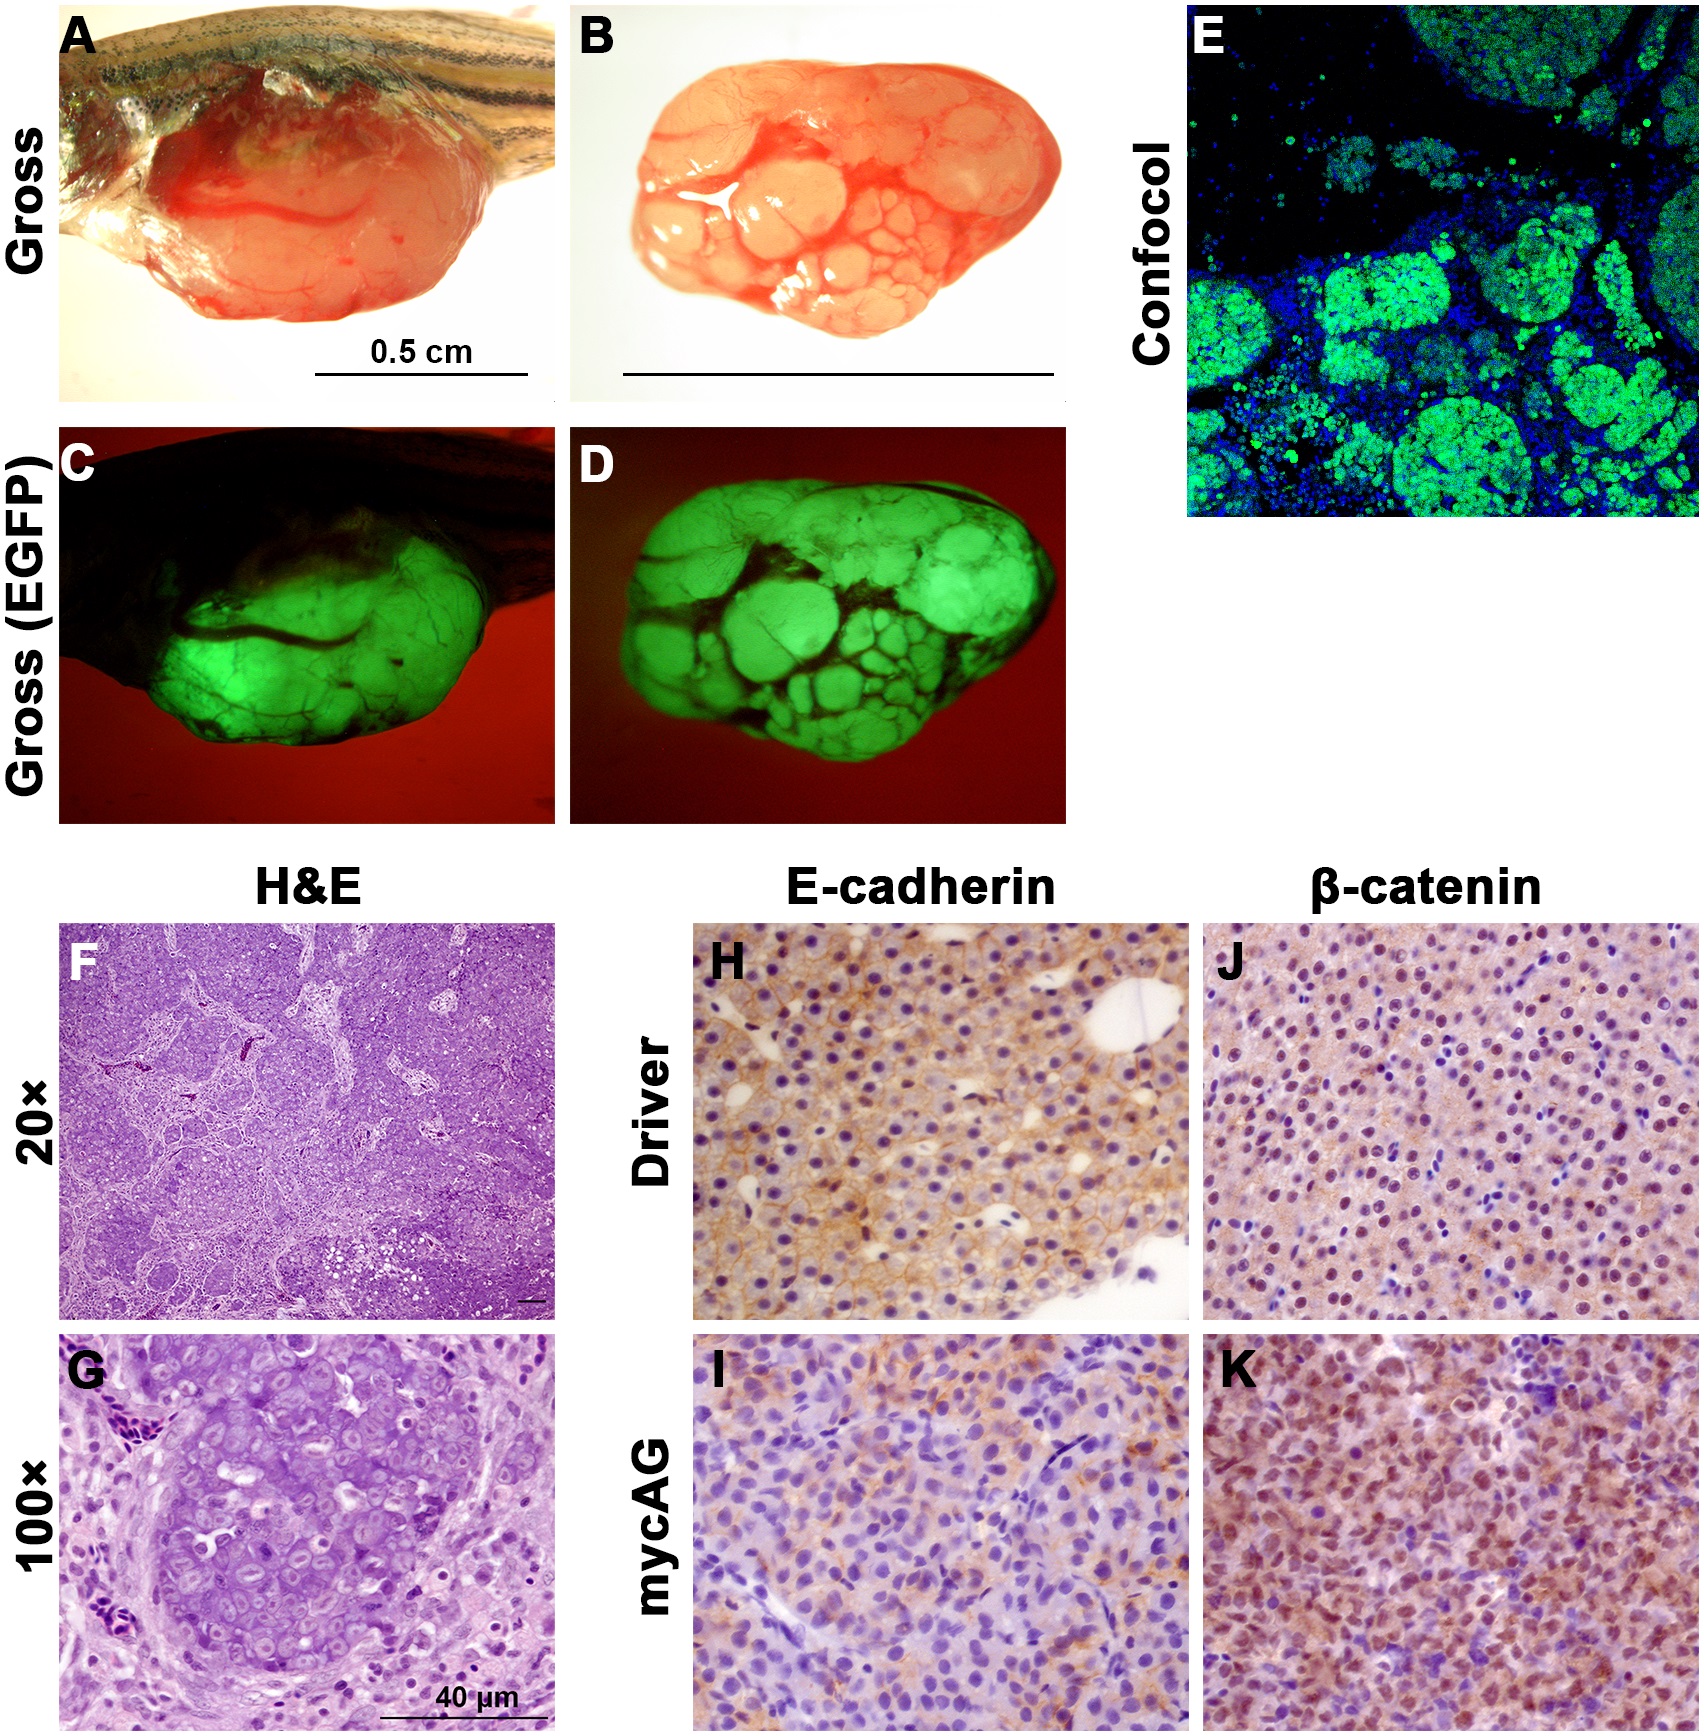
Fig. 4 Development of multinodular HCC in late stage of mifepristone induction.
MycAG fish were induced by 2 µM mifepristone from 1 mpf and sampled at 9 mpf (8 mpi) for gross observation, histological examination and immunocytochemistry. (A–D) Gross observation of multinodular HCC in two examples of mycAG fish in both bright field and GFP channel. (E) Confocal microscope image to show GFP positive hepatocytes and GFP negative cirrhosis stroma. (F,G) H&E staining of multinodular HCC sections with two different magnifications. (H,I) Immunocytochemical staining of E-cadherin in liver sections from a Driver fish (H) and a mycAG fish (I). (J,K) Immunocytochemical staining of β-catenin in liver sections from a Driver fish (J) and a mycAG fish (K).