
- Title
-
Neurobeachin Is Required Postsynaptically for Electrical and Chemical Synapse Formation
- Authors
- Miller, A.C., Voelker, L.H., Shah, A.N., Moens, C.B.
- Source
- Full text @ Curr. Biol.
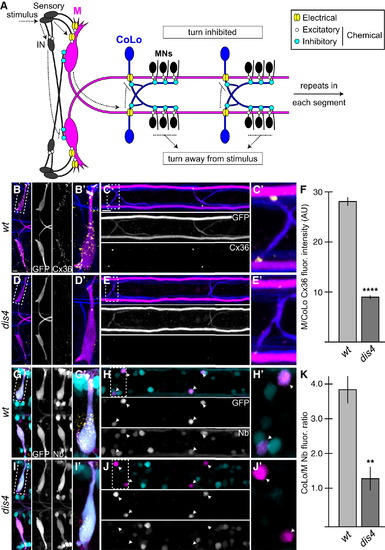
Electrical Synapses Are Disrupted in dis4 Mutants (A) Model of the Mauthner (M) circuit. Neurons, synapses, and behavioral output are depicted. Hindbrain and two spinal segments are shown. Dotted arrows depict flow of circuit activity given the indicated stimulus. (B–E and G–J) In this and all subsequent figures, except where noted, images are dorsal views of hindbrain and two spinal cord segments from M/CoLo:GFP larvae at 5 days postfertilization (dpf). The (′) panels are zooms of the regions denoted by the dotted boxes. Hindbrain and spinal cord images are maximum-intensity projections of <30 and <10 µm, respectively. Anterior is to the left. Scale bar represents 10 µm. Larvae are stained for GFP (magenta) and Connexin36 (Cx36, yellow) in all panels, neurofilaments (RMO44, blue) in (B)–(E), and Neurobiotin (Nb, cyan) in (G)–(J). Individual GFP, Cx36, and Nb channels are shown in neighboring panels. (B–E) The Cx36 staining found at M dendrites (B and B′) and M/CoLo synapses (C and C′) is reduced in dis4 mutant animals (D and E). (F) Quantitation of Cx36 at M/CoLo synapses in wild-type and dis4 mutants. (G–J) Electrical synapses are functionally defective in dis4 mutants. Images show experiments in which M axons were filled with the gap-junction-permeable dye Nb from a caudal transection in the spinal cord. Spinal cord images are at the level of the CoLo cell bodies (arrowheads), which are dorsal to the synapses. (G and H) Nb labels the M cell bodies and other caudally projecting neurons (G and G′) and passes through the Cx36 gap junctions to fill the CoLo cell bodies (H and H′, arrowheads). Other neurons are also labeled due to projections caudally into the lesion site. (I and J) In dis4 mutants, Nb labels M normally (I and I′); however, the amount passing into CoLos is diminished (J and J′, arrowheads). (K) Quantitation of ratio of Nb in CoLo to M cell bodies in wild-type and dis4 mutants. Graphs in (F) and (K) represent data as mean ± SEM. p < 0.01 and p < 0.0001 compared to control. Associated experimental statistics are found in Table S2. |
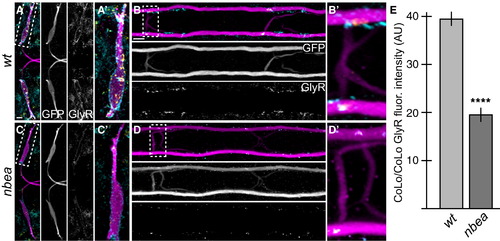
Glycinergic Synapses Are Disrupted in nbea Mutants Larvae were stained for GFP (magenta), Cx36 (yellow), and glycine receptor (GlyR, cyan). Individual GFP and GlyR channels are shown in neighboring panels. (A–D) The GlyR staining found on M dendrites (A) and CoLo/CoLo synapses (B) is diminished in nbea mutant animals (C and D). (E) Quantitation of the amount of GlyR in wild-type and mutant CoLo/CoLo synapses. See Figure 1A for circuit diagram. Graphs represent data as mean ± SEM. p < 0.0001 compared to control. Associated experimental statistics are found in Table S2. |
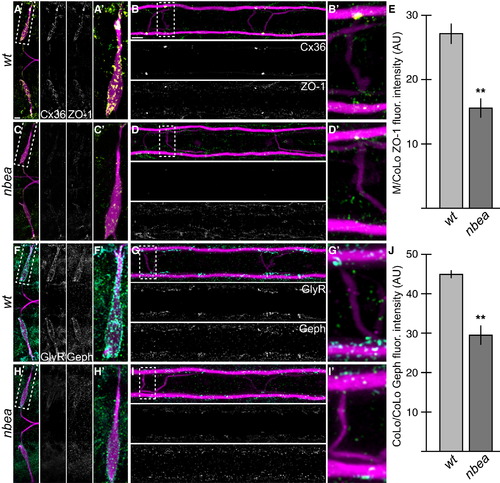
Electrical and Chemical Synaptic Scaffolds Are Disrupted in nbea Mutants (A–D and F–I) Larvae are stained for GFP (magenta) in all panels, Cx36 (yellow) and ZO-1 (green) in (A)–(D), and GlyR (cyan) and Gephyrin (Geph, green) in (F)–(I). Individual Cx36, ZO-1, GlyR, and Geph channels are shown in neighboring panels. Note that for each spinal cord zoom, there is only one M/CoLo and CoLo/CoLo synapse depicted; this is due to natural variation in the positions of CoLo neurons in the spinal cord. (A–D) The electrical synapse scaffold ZO-1 is colocalized with Cx36 at M dendritic (A and A′) and spinal cord (B and B′) synapses. ZO-1 staining is diminished in mutants (C and D), but less severely than Cx36. (E) Quantitation of ZO-1 at M/CoLo synapses in wild-type and nbea mutants. (F–I) The inhibitory synapse scaffold Geph is colocalized with GlyR at M dendritic (F and F′) and CoLo spinal cord (G and G′) synapses. Geph staining is diminished in mutants (H and I), but less severely than GlyR. (J) Quantitation of Geph at CoLo/CoLo synapses in wild-type and nbea mutants. Graphs in (E) and (J) represent data as mean ± SEM. p < 0.01 compared to control. Associated experimental statistics are found in Table S2. |
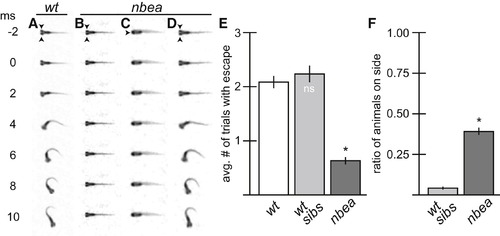
nbea Mutants Have Defects in Eliciting Normal Behavior (A–D) Individual frames from a 500 fps movie. Arrowheads point to eyes. Auditory startle stimulus was applied at time = 0 (ms = millisecond). (A) M is responsible for a fast-escape response to threatening stimuli and initiates a turn away from stimulus that is completed in 10 ms. (B–D) nbea mutant animals often fail to initiate turns (B) and are frequently found lying on their side (C). However, when they do respond, the behavior produced is indistinguishable from wild-type (D). (E and F) Quantitation of escape response and balance defects in a separate wild-type line (wt), nbea mutant animals, and their wt siblings (wt sibs). Each animal was tested in three separate trials for its response to stimulus. The average number of trials with response (E) or with animals on their sides (F) was recorded. Graphs represent data as mean ± SEM from three separate trials. p < 0.05 compared to control; ns, not significant. Associated experimental statistics are found inTable S3. PHENOTYPE:
|
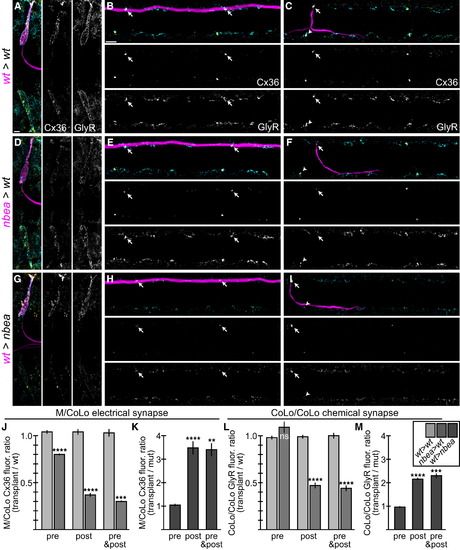
Neurobeachin Is Necessary and Sufficient in the Postsynaptic Neuron for Electrical and Chemical Synapse Formation (A-I) Dorsal views of chimeric larvae at 6 dpf containing GFP-marked cells transplanted from an M/CoLo:GFP embryo into an unmarked host. Larvae are stained for GFP (magenta), Cx36 (yellow), and glycine receptor (GlyR, cyan). Individual Cx36 and GlyR channels are shown in neighboring panels. Arrows point to M/CoLo electrical synapses. Arrows also point to the adjacent postsynaptic side of the CoLo/CoLo synapse associated with the upper left CoLo neuron. Arrowheads point to the presynaptic side of the glycinergic synapse associated with the upper left CoLo neuron. (A–C) Individual examples of control chimeric larvae with cells transplanted from a M/CoLo:GFP embryo into an unmarked wild-type host (wt>wt). (D–F) Examples of chimeric larvae testing where Nbea is necessary, with cells transplanted from a nbea mutant M/CoLo:GFP embryo into an unmarked wild-type host (nbea>wt). Note the greatly diminished synapses when the nbea mutant cell is the postsynaptic neuron (D and F). (G–I) Examples of chimeric larvae testing where Nbea is sufficient, with cells transplanted from an M/CoLo:GFP embryo into an unmarked nbea mutant host (wt>nbea). Note that synapses are rescued when the postsynaptic neuron is wild-type for Nbea (G and I). (J–M) Quantitation of the ratio of Cx36 fluorescence at M/CoLo or GlyR fluorescence at CoLo/CoLo synapses at transplant-associated neurons compared to unassociated neurons within the same animal in wt>wt and nbea>wt chimeras (J and L) and wt>nbea chimeras (K and M). Graphs represent data as mean ± SEM. p < 0.01, p < 0.001, p < 0.0001 compared to control; ns, not significant. Associated experimental statistics are found in Table S4. |
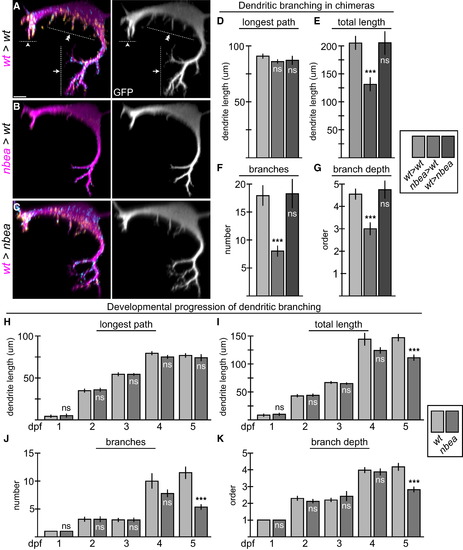
Neurobeachin Is Required Autonomously to Maintain Dendritic Complexity (A–C) Cross-section views of individual chimeric larvae containing GFP-marked cells from M/CoLo:GFP embryos in unmarked hosts at 6 dpf. Images are maximum-intensity projections of <20 µm from digitally rendered cross-sections. For clarity, fluorescence signal outside of the GFP-labeled neurons has been digitally removed. Ventral is down, lateral is to the left. Scale bar represents 10 µm. Larvae are stained for GFP (magenta), Cx36 (yellow), and GlyR (cyan). The GFP channel is shown in neighboring panels. (A) In wild-type (wt>wt), M elaborates complex dendrites with three main compartments: ventral (arrow), lateral (arrowhead), and somatic (double arrowhead). (B) When M is nbea mutant in an otherwise wild-type host (nbea>wt), the M dendrites lose the fine terminal branches of the dendritic arbor. (C) When M is wild-type in a nbea mutant host (wt>nbea), the dendritic complexity is similar to wild-type. (D–G) Quantitation of M ventral dendrite parameters in chimeric embryos. (H–K) Quantitation of changes in the ventral dendrite from 1 to 5 dpf in wild-type and nbea mutant embryos. “Longest path” is the longest continuous main path from cell body to dendrite tip. “Total length” is the sum of the lengths of all the dendritic branches. “Branches” is the sum of the number of branches made off of the main, longest branch. “Branch depth” is the maximum depth of branching, with the main branch being primary and all subsequent branches being labeled sequentially. Graphs in (D)–(K) represent data as mean ± SEM. p < 0.001 compared to control; ns, not significant. Associated experimental statistics are found in Table S5. |
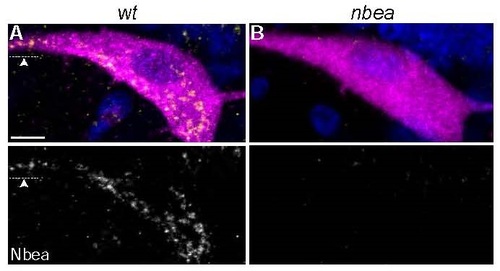
Punctate cytoplasmic Neurobeachin staining is lost in nbea mutants. A,B. Cross section views of M from M/CoLo:GFP transgenic embryos at 5 days post fertilization. Larvae are stained for GFP (magenta), Neurobeachin (Nbea, yellow), and DAPI (blue). Individual Nbea channels are shown in neighboring panels. A. Wildtype Nbea staining appears punctate throughout the cell body and extends out into dendrites (arrowhead). B. Nbea staining is lost in nbea mutants. Images are maximum intensity projections of ~20µm. Ventral is down, lateral is left. Arrowhead points to lateral dendrite. Scale bar = 10 µm. EXPRESSION / LABELING:
|
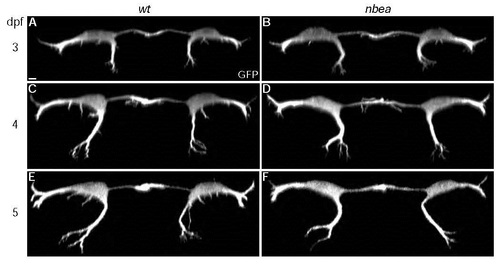
Neurobeachin is required to maintain dendritic complexity. Cross section views of individual larvae from M/CoLo:GFP transgenic embryos at noted days post fertilization (dpf). Individual GFP channels are shown. A,C,E. In wildtype (wt) dendritic branching in all compartments gets progressively more complex over time. B,D,F. In nbea mutants dendritic outgrowth and branching initiate normally but fail to maintain complexity at 5dpf. Images are maximum intensity projections of ~20µm from digitally rendered cross sections. For clarity, fluorescent signal outside of the GFP-labeled neurons was digitally removed. Scale bar = 10 µm. Ventral is down. EXPRESSION / LABELING:
PHENOTYPE:
|