
- Title
-
Papp-a2 modulates development of cranial cartilage and angiogenesis in zebrafish embryos
- Authors
- Kjaer-Sorensen, K., Engholm, D.H., Jepsen, M.R., Morch, M.G., Weyer, K., Hefting, L.L., Skov, L.L., Laursen, L.S., Oxvig, C.
- Source
- Full text @ J. Cell Sci.
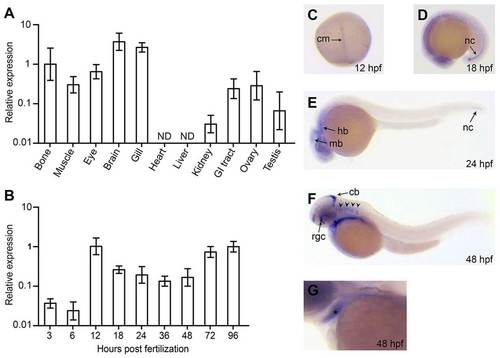
Expression analysis of papp-a2 in zebrafish embryos, larvae and adults. (A) Quantitative RT-PCR analysis of papp-a2 mRNA in adult tissues. Analysis was performed on pooled organs from three females, with the exception of testes, which were dissected and pooled from two males. ND, not detected. (B) Quantitative RT-PCR analysis of papp-a2 expression levels during early development (30–50 embryos per group). papp-a2 expression was normalized relative to that of beta-2-microglobulin and fold change was calculated relative to bone (A) or 96 hpf (B), respectively. Plotted values are mean±s.d. of triplicate measurements. (C–G) Whole mount in situ hybridization showing papp-a2 expression at 12 (C), 18 (D), 24 (E), and 48 hpf (F,G). G is a magnified section of a stained 48 hpf embryo showing expression in the lower jaw (*). Anterior to the left, dorsal to the top, except 12 hpf, which is dorsal view, animal pole to the top. cm, chordamesoderm; nc, notochord; mb, midbrain; hb, hindbrain; cb, cerebellum; rgc, retinal ganglion cell layer; arrowheads, hindbrain ganglia. Identical staining patterns were observed when using two other non-overlapping probes, and no signal was observed using sense probe at any developmental stage (not shown). |
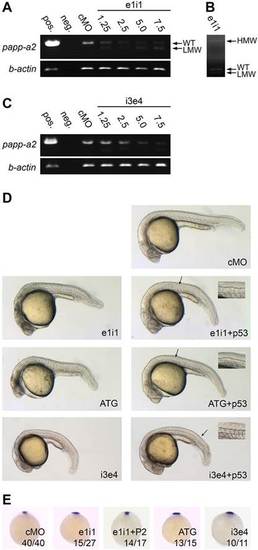
papp-a2 knockdown causes ventral curvature and notochord defects. (A,B) RT-PCR analysis of the effect of papp-a2-targeted morpholino ei1i on papp-a2 pre-mRNA splicing showing a fast-migrating band (LMW) (A) resulting from the use of a cryptic splice donor site in exon 1, and a slow-migrating band (HMW) (B) resulting from the retention of intron 1 as determined by sequencing. These mis-spliced transcripts encode amino acid residue 1–242 or 1–275 of the prepro-protein plus eight or 30 residues, respectively, encoded by intron 1 followed by a stop codon. Values for e1i1 are the amount of morpholino in ng per embryo. WT, wild type. (C) RT-PCR analysis of the effect of papp-a2-targeted morpholino i3e4 on papp-a2 pre-mRNA splicing. Values for i3e4 are the amount of morpholino in ng per embryo. (D) 24 hpf embryos injected with 5.0ng control morpholino (cMO), 5.0ng papp-a2-targeted splice inhibiting morpholino (e1i1), 2.5ng translation inhibiting morpholino (ATG), or 2.0ng splice-inhibiting morpholino (i3e4) with or without 5ng p53-targeted morpholino (p53). Necrosis of the central nervous system was observed from both e1i1 and ATG, indicating non-specific p53-activating activity (Ekker and Larson, 2001; Robu et al., 2007). Co-injection with p53-targeting morpholino (Robu et al., 2007) specifically diminished the observed necrosis, whereas the other phenotypes remained unaffected. p53-targeting morpholino was included in all subsequent knockdown experiments. Insets show a magnified in view from the area indicated by the arrow. Notochord outlines are indicated with dashed lines. (E) noto whole mount in situ hybridization of 9 hpf embryos. e1i1+P2 indicates co-injection of e1i1 morpholino with 500pg Papp-a2-encoding mRNA. Numbers indicate fractions of embryos displaying the depicted phenotype. Animal pole view, dorsal to the top. PHENOTYPE:
|
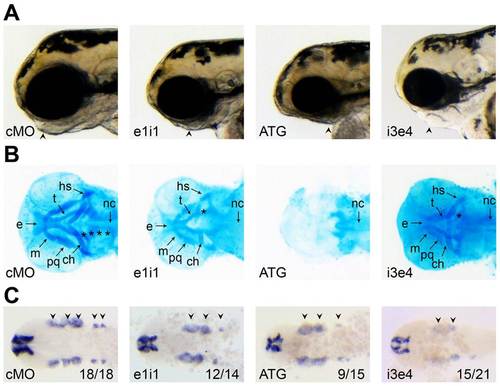
Papp-a2 is required for normal development of cranial cartilages. (A) Standard light microscopy images of papp-a2-knockdown and control embryos showing severely reduced jaw development. Lateral views, anterior to the left. (B) staining of papp-a2 knockdown and control embryos showing reduction or absence of the ethmoid (e), trabecula cranii (t), Meckel′s cartilage (m), palatoquadrate (pq), ceratohyal (ch), hyosymplectic (hs), and the five caudal branchial arches (*). Nc, notochord. (C) Flat-mounted 24 hpf zebrafish embryos whole mount in situ stained for dlx2a. Numbers indicate the fraction of embryos displaying the depicted phenotype. Dorsal view, anterior to the left. Arrowheads, clusters of dlx2a-positive postmigratory cranial neural cells. EXPRESSION / LABELING:
PHENOTYPE:
|
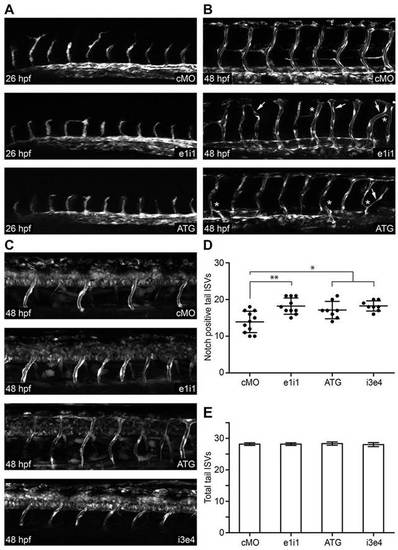
papp-a2 knockdown causes angiogenesis defects and modulates vascular Notch signaling activity. (A,B) Representative z-stack projections of fluorescence microscopy images of control and papp-a2-knockdown Tg(fli1a:eGFP) zebrafish embryos at 26 hpf (A) and 48 hpf (B). Arrows, ISVs extending across somites; asterisks, abnormal ISV branching. (C) Representative z-stack projections of fluorescence microscopy images of control and papp-a2-knockdown embryos at 48 hpf in Notch activity reporter zebrafish embryos [Tg(Tp1bglob:eGFP)um13]. Knockdown was performed using 1.25ng ATG, 5.0ng e1i1, or 2ng i3e4 papp-a2-targeted morpholino per embryo. As a negative control, 5 ng cMO was injected. All pictures are lateral views, anterior to the left and dorsal to the top. (D) Number of Notch-signaling positive (the mean±s.d. is indicated) ISVs in the tails of 48 hpf control and papp-a2-knockdown embryos. *P<0.05, **P<0.01; n = 11 (cMO), 10 (e1i1), 8 (ATG), 8 (i3e4). (E) Total number of ISVs (the mean ± s.d. is indicated) in the tails of 48 hpf control and papp-a2 knockdown Tg(fli1a:eGFP) embryos. n = 6 per treatment. |
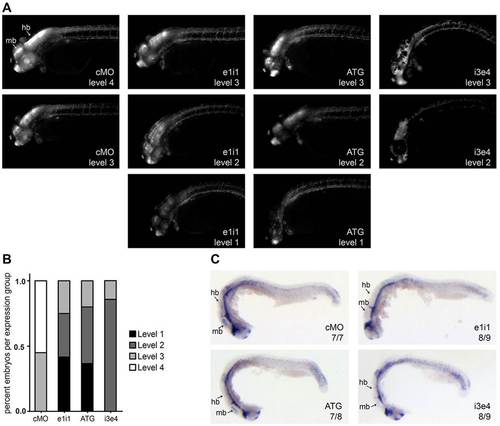
papp-a2-knockdown reduces Notch signaling activity in the CNS. (A) Representative images of control and papp-a2-knockdown Notch activity reporter embryos [Tg(Tp1bglob:eGFP)um13] showing the range of Notch reporter fluorescence levels. Embryos were grouped according to fluorescence levels ranging from 1 (very low Notch signaling activity) to 4 (maximum Notch signaling activity). (B) Plot showing the percentage of embryos at each fluorescence level in control and knockdown embryos. n = 20 (cMO), 24 (e1i1), 30 (ATG), 14 (i3e4). (C) her6 whole-mount in situ hybridization of 24 hpf embryos. Numbers indicate fractions of embryos displaying the depicted phenotype. hb, hindbrain; mb, midbrain. |