
- Title
-
Toxicity and estrogenic endocrine disrupting activity of phthalates and their mixtures
- Authors
- Chen, X., Xu, S., Tan, T., Lee, S.T., Cheng, S.H., Lee, F.W., Xu, S.J., Ho, K.C.
- Source
- Full text @ Int. J. Environ. Res. Public Health

Representative photos of zebrafish (Danio rerio) embryos exposed to phthalates and phthalate mixture. (A): control; (B): 0.50 ppm BBP; (C): 1.50 ppm DBP; (D): mixture containing 0.50 ppm of BBP, DBP, DEHP, DIDP, DIDP and DNOP, respectively. Representative toxicity symptoms caused by phthalates includes death (empty triangle), tail curvature (solid arrow), necrosis (empty arrow), cardio edema (arrowhead) and no touch response. |

Estrogenic activity of phthalate BBP. (A): BBP (1.50 ppm) induced GFP signal intensity (RFU) compared to that of E2 (2.00 ppb), data are mean ± standard error of the mean; (B): Representative photos of the livers of transgenic medaka (O. melastigma) eleutheroembryos after 24-h exposure to E2 (2.00 ppb) and BBP (1.50 ppm). Scale bar equals to 100 μm. |
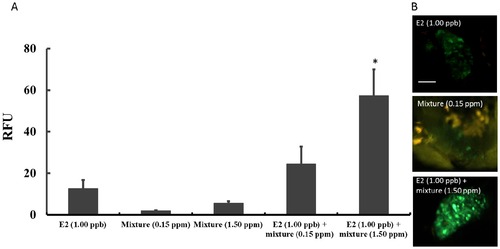
Enhanced-estrogenic activity of phthalate mixtures. (A): The GFP signal intensity (RFU) induced by E2 (1.00 ppb), mixtures containing 0.15 and 1.50 ppm of BBP, DBP, DEHP, DIDP, DINP and DNOP respectively, and E2 together with mixtures of 0.15 and 1.50 ppm respectively. (B): Representative images of the livers of transgenic medaka (O. melastigma) eleutheroembryos after 24-h exposure to E2 (1.00 ppb), phthalate mixture (0.15 ppm) and E2 (1.00 ppb) + phthalate mixture (1.50 ppm) respectively. |