
- Title
-
Mitotic Position and Morphology of Committed Precursor Cells in the Zebrafish Retina
- Authors
- Weber, I.P., Ramos, A.P., Strzyz, P.J., Leung, L.C., Young, S., and Norden, C.
- Source
- Full text @ Cell Rep.
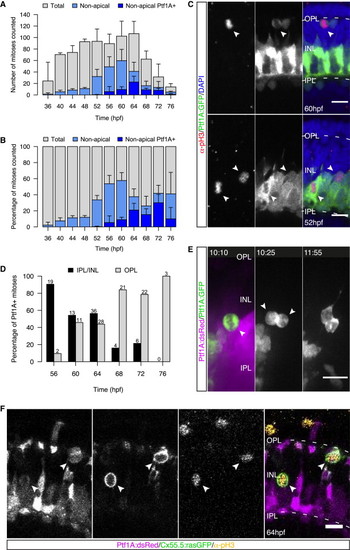
HC Precursors Divide at Multiple Positions but Do Not Account for All Nonapical Divisions (A) Total number of pH3+ cells (gray), nonapically dividing cells (light blue), and Ptf1A+ nonapically dividing cells (dark blue) counted at each time point/embryo. Error bars represent SD; n = 2–6 embryos per time point. (B) Data from (A) as percentage of all counted mitoses. Error bars represent SD. (C) Ptf1A:GFP (green) embryos stained for pH3 (red) and DAPI (blue). Ptf1A+/pH3+ cells are found adjacent to the OPL (top, arrows) and within the AC layer (bottom, arrows). (D) Quantification of the location of Ptf1A+/pH3+ cells as percentage of pH3+ cells. Numbers on top of bars indicate number of dividing cells counted. n = 3 embryos/time point, pooled. (E) INL division of a Ptf1A:GFP cell gives rise to two Ptf1A+ daughters (arrows). Time in hr:min. Imaging started at 46 hpf. (F) pH3 staining (yellow) of a Ptf1a:dsRed/Cx55.5:rasGFP (magenta/green) embryo. All cells in the INL and adjacent to the OPL immunoreactive for pH3 express Ptf1A:dsRed and Cx55.5:rasGFP (arrows). Scale bars represent 10 μm. See also Figure S1 and Movie S1. |
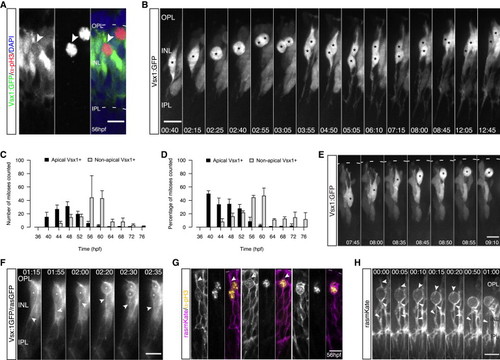
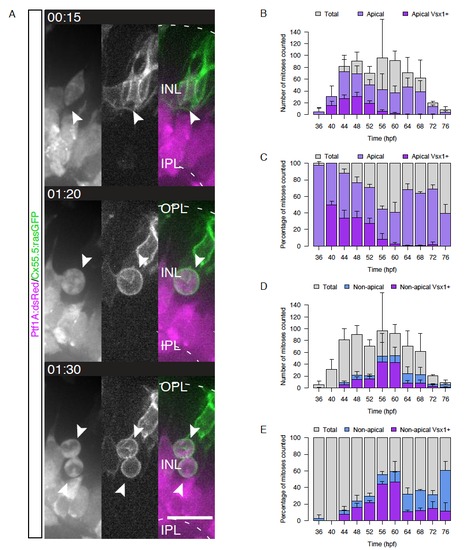
Nonapically Dividing Monopolar Vsx1+ Precursors Give Rise to Two Bipolar Cells (A) pH3 (red) and DAPI staining (blue) in a Vsx1:GFP (green) embryo. pH3+/Vsx1+ cells are observed in the INL (arrows). (B) Two Vsx1+ cells arise from a nonapically dividing Vsx1:GFP cell, align in the INL, and feature BC morphology (asterisk) (from Movie S2). Time hr:min. Imaging started 50 hpf. (C) Time course showing counts of apically and nonapically dividing Vsx1+ cells/embryo (36–76 hpf; 4 hr intervals). Error bars represent SD; n = 2–3 embryos per time point. (D) Data from (C) as percentage of all counted mitoses. Error bars represent SD. (E) Vsx1:GFP cell bodies undergo IKNM-like movement prior to subapical division (asterisk). Time in hr:min. Imaging started at 48 hpf. (F) A transplanted Vsx1:GFP/rasGFP cell divides adjacent to the OPL (asterisk), featuring a basal process before, during, and after mitosis (notched arrows). Time in hr:min. Imaging started at 52 hpf. (G) Embryos mosaically injected with rasmKate RNA (magenta) stained for pH3 (yellow). Cells are attached apically in late G2 (left, arrows). An apical process is present at the beginning of cell rounding (arrows, middle) but lost upon entry into mitosis (right). (H) Time-lapse of an embryo mosaically injected with rasmKate. Upon onset of cell rounding, an apical process can be observed (notched arrows), which is lost upon entry into mitosis. Filled arrows point toward basal process; from Movie S3. Time in hr:min. Imaging started at 56 hpf. Scale bars represent 10 μm. See also Figure S1. |
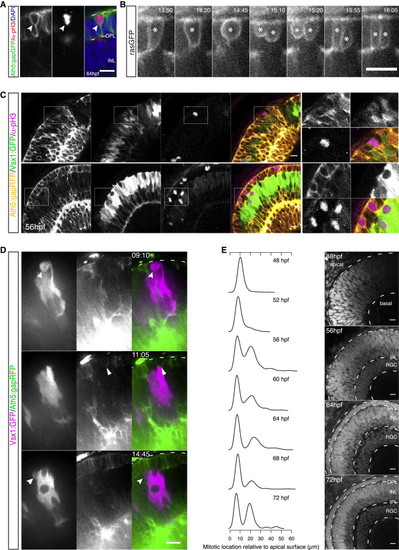
Emergence of the Photoreceptor Cell Layer Leads to Repositioning of Bipolar Cell Precursor Divisions (A) A pH3+/Ath5+ (red/green) cell within the PR layer (DAPI counterstaining in blue). (B) A rasGFP+ cell (asterisk) undergoes division within the PR layer, giving rise to two daughters with PR-like morphology (from Movie S4). Time in hr:min. Imaging started at 50 hpf. (C) An Ath5:gapRFP/Vsx1:GFP (yellow/green) embryo stained for pH3 (magenta) at 56 hpf. Mitoses of Vsx1+ cells occur apically in regions without a complete PR layer (top). In regions with an established PR layer, Vsx1+ divisions are shifted toward subapical locations (bottom). pH3+ cells at the apical side are Ath5+. Scale bar represents 25 μm. (D) Time-lapse of Vsx1:GFP cells (magenta) transplanted into Ath5:gapRFP (green) background. Vsx1+ cells divide apically in regions without an established PR layer (top, notched arrow). Apical Ath5+ divisions can be observed in regions where PR precursors start to occupy the apical side (middle, filled arrow). Once a compact PR layer is established at the apical side, Vsx1+ divisions occur subapically (bottom, arrow). Time in hr:min. Imaging started at 44 hpf. (E) Normalized kernel density estimates showing distributions of division locations in control embryos over time (left). Progression of retinal layer formation shown by DAPI staining (right). The emerging groove in the kernel density corresponds to the forming OPL. If not stated differently, scale bars represent 10 μm. See also Figure S2. |
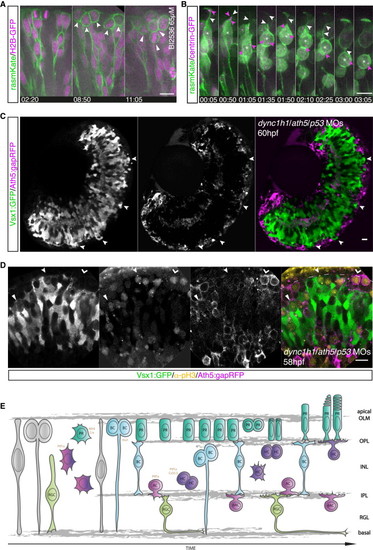
Correlation between Apical Crowding and Repositioning of Mitotic Cells to Nonapical Locations (A) The Plk1 inhibitor BI2536 leads to mitotic arrest. Embryos are mosaically injected with rasmKate (green) and H2B-GFP (magenta). Neuroepithelial progenitors translocate their nuclei to the apical side and undergo apical mitosis (left). Cells enter mitosis at the apical side but fail to undergo division, leading to apical accumulation of mitotic cells (notched arrow, middle). Emergence of additional layers of mitotic cells at subapical locations (filled arrow, right); from Movie S6. Time in hr:min. Imaging started at 32 hpf. (B) Embryos were mosaically injected with rasmKate (green) and centrin-GFP (magenta) and treated with BI2536 (65 μM). A retinal progenitor cannot reach the apical side and enters mitosis subapically (asterisk) upon apical congestion. The apical location of the centrosome is shown (00:05, pink arrows). The centrosome moves toward the nucleus (01:35). The apical process is present at the onset of cell rounding (01:35, white arrows) but lost after centrosome migration (03:05). Time in hr:min. Imaging started at 36 hpf. (C) Discontinuous PR layer formation in Ath5:gapRFP (magenta) dync1h1/ath5/p53 morphants (MO). In PR-free areas, Vsx1:GFP (green) cells reach the apical side (arrows). (D) pH3 staining (yellow) in Vsx1:GFP/Ath5:gapRFP (green/magenta) dync1h1/ath5/p53 morphant embryos. Vsx1+ divisions are observed subapically in regions with an Ath5+ PR layer (filled arrow) but apically in regions in which the PR layer is disrupted (notched arrow). Apical Ath5+ divisions are observed in regions in which an Ath5+ cell layer forms (kinked arrow). (E) Model of zebrafish retinogenesis, taking previous data and our findings into account. Scale bars represent 10 μm. See also Figure S3. |
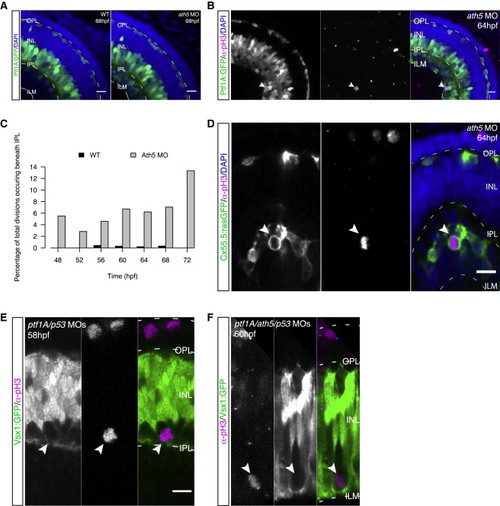
Depletion of Specific Neuronal Subtypes Leads to Ectopic Basal Mitosis of Committed Precursors (A) Control (left) and ath5 morphant embryo (MO; right) expressing Ptf1A:GFP (green) and stained for DAPI (blue). In the morphant, the prospective RGC layer is filled with Ptf1A+ cells. (B) Ptf1A:GFP (green) embryo injected with ath5 MO and stained for pH3 (magenta) and DAPI (blue). Ptf1A+ division at very basal location (arrows). (C) Percentage of cell divisions taking place beneath the IPL in control versus ath5 morphant embryos. Data are pooled from six embryos per time point. (D) Cx55.5:rasGFP (green) ath5 morphant embryo stained for pH3 (magenta) and DAPI (blue). pH3+/Cx55.5+ cells are observed underneath the IPL (arrows). (E) In ptf1A/ath5/p53 morphants (MO), an ectopic basal division close to the forming IPL occurs. pH3 is shown in magenta, Vsx1:GFP in green, and DAPI in blue. (F) In ptf1A/ath5/p53 MO, ectopic Vsx1+ divisions are observed close to the ILM. pH3 is shown in magenta, Vsx1:GFP in green, and DAPI in blue. Scale bars represent 10 μm. See also Figure S3. |
A) HC precursors dividing in the INL are non-polar, Related to Figure 1. Live imaging of Ptf1A:dsRed/Cx55.5:rasGFP double transgenic embryos. Time in hr:min. Imaging started at 48hpf. B)-E) Time-courses showing the absolute and relative number and location of Vsx1+ divisions, Related to Figure 2. B) Counts of apical Vsx1+ divisions (magenta) overlaid on counts of all apical divisions (light purple) and counts of all divisions (grey). C) Apical Vsx1+ divisions (magenta) and apical divisions (light purple) as a percentage of all divisions counted. D) Counts of non-apical Vsx1+ divisions (magenta) overlaid on counts of all non-apical divisions (light blue) and counts of all divisions (grey). E) Non-apical Vsx1+ divisions (magenta) and non-apical divisions (light purple) as a percentage of all divisions counted. For all graphs shown n=2-3 embryos/time point and error bars = SD. |
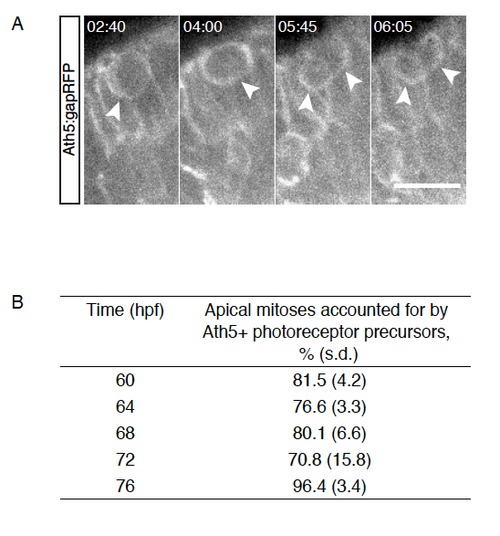
Late apical divisions give rise to photoreceptors, Related to Figure 3 A) Tg(Ath5:gapRFP); An Ath5+ cell divides within the PR layer and gives rise to two Ath5+ daugther cells. Time is hr:min. Imaging started at 60hpf. B) Percentage of apical mitoses accounted for by Ath5+ cells dividing within the PR layer between 60hpf and 76hpf (4h intervals). n=2-3 embryos/ time point. |
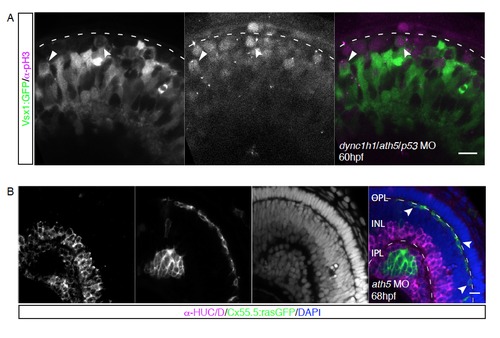
A) Apical division of Vsx1+ cells upon knockdown of ath5 and dync1h1, Related to Figure 4. Vsx1:GFP (green) transgenic embryos injected with a combination of morpholinos against dync1h1, ath5 and p53, stained for pH3 (magenta). Apical (arrow) and non-apical (notched arrow) divisions of Vsx1+ cells. B) Horizontal cells inhabit the most basal layer in ath5 morphants, Related to Figure 5. Cx55.5:rasGFP (green) transgenic embryos injected with 4ng ath5 morpholino, stained with the AC/RGC marker α-HUC/D (magenta) and DAPI (blue). Arrows point towards Cx55.5+ HCs in the HC layer. |