
- Title
-
Different Regulation of Physiological and Tumor Angiogenesis in Zebrafish by Protein Kinase D1 (PKD1)
- Authors
- Hollenbach, M., Stoll, S.J., Jörgens, K., Seufferlein, T., and Kroll, J.
- Source
- Full text @ PLoS One
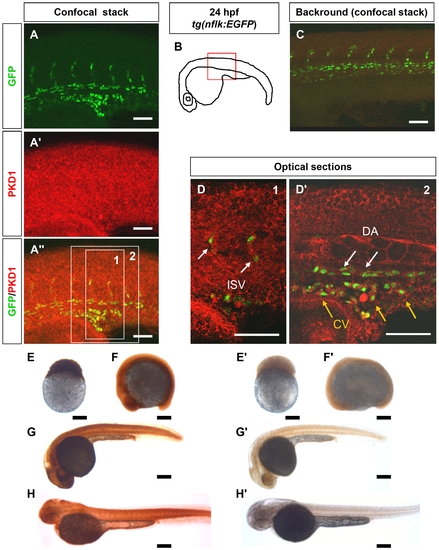
PKD1 expression in 24 hpf tg(nflk:EGFP) zebrafish embryo and in zebrafish development. A–A3, Whole mount antibody staining for PKD1 in 24 hpf tg(nflk:EGFP) zebrafish embryos. Pictures show whole confocal stacks of several optical sections. GFP signal is shown in green (A), PKD1 staining in red (A2), (A3) displays the merge. Box 1 and 2 mark the area where single optical sections were selected from (D, D2). B, Scheme of a 24 hpf embryo. The red box marks the area of confocal images in (A). C, for background control, embryo was stained without antibody against PKD1. D, Optical sections of the embryo, where colocalization of nuclear GFP signal in endothelial cells (green) and PKD1 expression (red) is shown. ISV: intersomitic vessel. DA: dorsal aorta. CV: cardinal vein. E–H2, Expression of PKD1 during zebrafish embryogenesis indicated ubiquitous distribution of the PKD1 protein at the 256-cell stage, 14-somite stage, 24 hpf and 48 hpf as shown by whole mount PKD1 antibody staining (E–H). E2–H2, Whole mount antibody control stainings lacking the primary PKD1 antibody. White scale bars: 100 μm; black scale bars: 300 μm. |
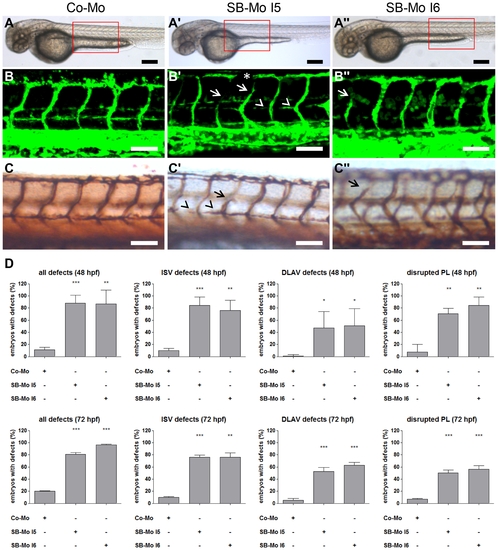
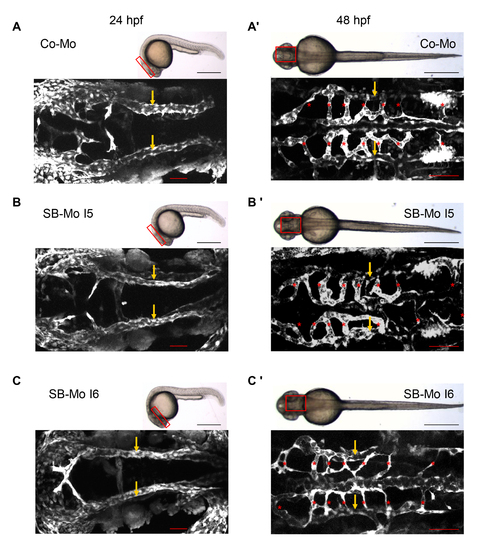
PKD1 expression silencing resulted in slight vascular defects in tg(fli1:EGFP) zebrafish embryos. A–A3, Overall morphology of Co-Mo - injected (2 ng) or PKD1 SB-Mo I5 or I6 - injected (500 pg) 48 hpf embryos did not show morphological alterations. Red boxes indicate regions of pictures shown in (B–C3). B–C3, Embryos were analyzed at 48 hpf by confocal microscopy (B–B3) or anti-GFP antibody staining (C–C3). Morpholino-based silencing of PKD1 in zebrafish disrupted partially formation of intersomitic vessels (ISVs) (arrows), the dorsal longitudinal anastomotic vessel (DLAV) (asterisks), and the parachordal lymphangioblasts (PL) (arrowheads) (B–C3). D, Quantification of the number of embryos with vascular defects, ISV defects, DLAV defects and disrupted PL at 48 hpf and 72 hpf. For each group at least 40 embryos were analyzed. White scale bars: 100 μm; black scale bars: 300 μm. *P<0.05, **P<0.01, ***P<0.001. |
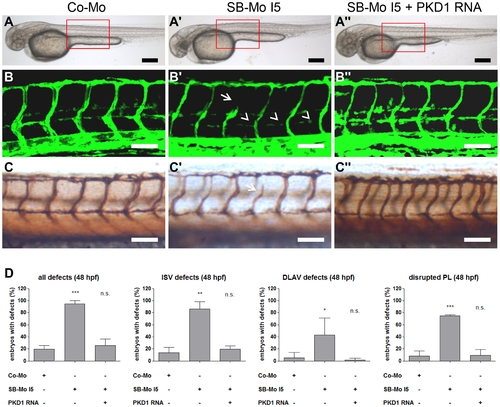
Injection of human PKD1 mRNA rescued vascular defects in PKD1 morphant tg(fli1:EGFP) zebrafish embryos. A–A3, Overall morphology of Co-Mo - injected (2 ng), PKD1 SB-Mo I5 - injected (500 pg) or of SB-Mo I5 and PKD1 mRNA (100 pg) co-injected fish embryos showed no morphological alterations. Red boxes indicate regions of pictures shown in (B–C3). B–C3, Embryos were analyzed at 48 hpf by confocal microscopy (B–B3) or anti-GFP antibody staining (C–C3). Morpholino-based expression silencing of PKD1 in zebrafish disrupted partially formation of the vasculature (ISVs (arrows), PL (arrowheads)) (B2, C2). Coinjection of SB-Mo I5 (500 pg) and PKD1 mRNA (100 pg) rescued the vascular malformation in PKD1 morphants (B3, C3). D, Quantification of the number of embryos with vascular defects, ISV defects, DLAV defects and disrupted PL at 48 hpf. For each group at least 40 embryos were analyzed. Black scale bars: 300 μm; white scale bars: 100 μm. *P<0.05, **P<0.01, ***P<0.001. |
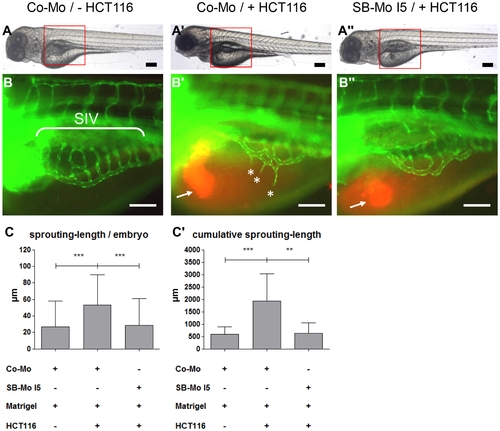
Tumor angiogenesis is abolished in PKD1 morphant tg(fli1:EGFP) zebrafish embryos. A–A3, Overall morphology of Co-Mo - injected (2 ng) or PKD1 SB-Mo I5 - injected (500 pg) 96 hpf embryos. At 48 hpf 1–4 nl of Matrigel (A, B) or Matrigel/HCT116 solution (A2, A3, B2, B3) was injected in the perivitelline space. Red boxes indicate regions of pictures shown in (B–B3). B–B3, HCT116 induced tumor angiogenesis as indicated by sprouting of subintestinal venous plexus (SIV) was analyzed at 96 hpf in tg(fli1:EGFP) embryos. Injection of HCT116 tumor cells (labeled with VybrantDil in red, arrow) led to a strong formation of ectopic blood vessels originated from the SIV (asterisks). In PKD1 morphants ectopic blood vessel formation was completely blocked. C–C2, Quantification of sprouting length per embryo (C) and cumulative sprouting length (C2) with S.D. of at least 30 embryos per group. For cumulative sprouting-length all sprouts of the same number of embryos per group were summed, (C2) represents means of three independent experiments with S.D. Black scale bars: 300 μm; white scale bars: 100 μm. *P<0.05, **P<0.01, ***P<0.001. |
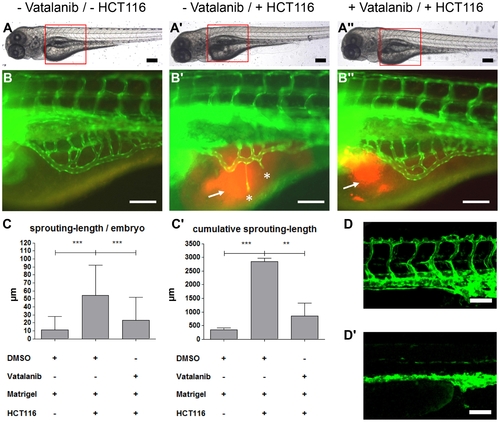
VEGF receptor-2 antagonist Vatalanib inhibited HCT116 induced tumor angiogenesis in tg(fli1:EGFP) zebrafish embryos. A–A3, Overall morphology of 96 hpf embryos after injection of 1–4 nl of Matrigel (A, B) or Matrigel/HCT116 solution (A2, A3, B2, B3) in the perivitelline space at 48 hpf. Directly after HCT116 tumor cell injection embryos were incubated in presence of 0.1 μM Vatalanib (A3, B3) or DMSO (A, A2, B, B2) for additional 48 hours. Red boxes indicate regions of pictures shown in (B–B3). B–B3, HCT116 induced angiogenesis as indicated by ectopic vessel formation originated from the subintestinal venous plexus (SIV) was analyzed at 96 hpf in tg(fli1:EGFP) embryos. Injection of HCT116 tumor cells led to strong ectopic vessel formation (asterisks) that was completely inhibited in Vatalanib treated zebrafish embryos. C–C2, Quantifications with S.D. of at least 30 embryos per group. For cumulative sprouting-length all sprouts of the same number of embryos per group were summed, (C2) represents means of three independent experiments with S.D. D–D2, Effect of Vatalanib on physiological angiogenesis in 48 hpf tg(fli1:EGFP) embryos. Embryos were incubated with DMSO (D) or 0.1 μM Vatalanib (D2) immediately after fertilization. Incubation with Vatalanib completely inhibited formation of ISV, DLAV and PL. Black scale bars: 300 μm; white scale bars: 100 μm. *P<0.05, **P<0.01, ***P<0.001. |
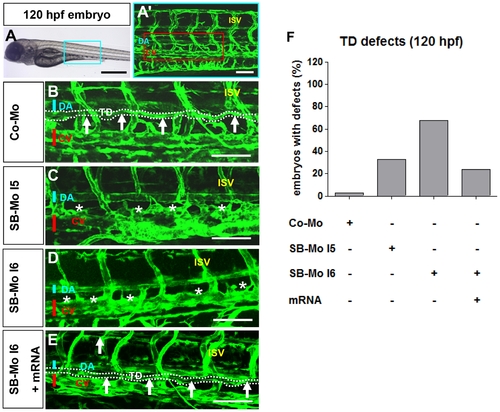
PKD1 expression silencing disturbed formation of thoracic duct in 120 hpf tg(fli1:EGFP) zebrafish embryos. A–A2, Bright-field image (A) and confocal microscopy (A2) of 120 hpf Co-Mo - injected (2 ng) zebrafish embryo showed physiological formation of thoracic duct (TD). The blue box marks the region shown in (A2). The red box marks the region shown in (B–E). DA: dorsal aorta, CV: cardinal vein, ISV: intersomitic vessel, TD: thoracic duct. C–D, Confocal microscopy of 120 hpf SB-Mo I5 - injected (500 pg) (C) and SB-Mo I6 - injected (500 pg) (D) embryos indicated a complete absence of TD (asterisks). E, Confocal microscopy of 120 hpf coinjected (500 pg SB-Mo I6 and 100 pg PKD1 mRNA) embryos showed a rescue effect on TD formation. F, Quantification of embryos with defects injected with Co-Mo (2 ng), SB-Mo I5 (500 pg), SB-Mo I6 (500 pg) or coinjection (SB-Mo I6 and mRNA). At least 30 embryos per group were analyzed. Blue bar indicates dorsal aorta (DA), red bar cardinal vein (CV) and arrows and dotted line the TD. Scale bars: 100 μm. |
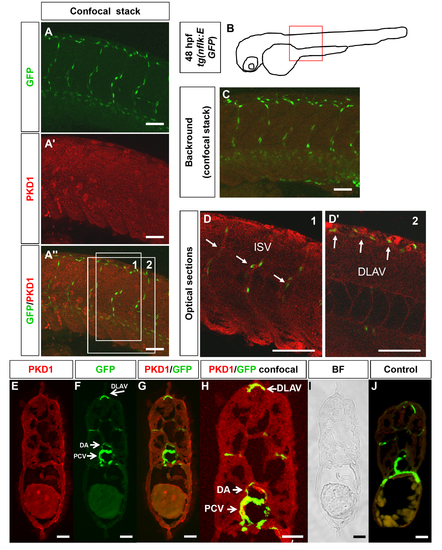
PKD1 expression in 48 hpf zebrafish embryo. A–A3, Whole mount antibody staining for PKD1 was performed in 48 hpf tg(nflk:EGFP) zebrafish embryos. Pictures show whole confocal stacks of several optical sections. GFP signal is shown in green (A), PKD1 staining in red (A2), (A3) displays the merge. Box 1 and 2 mark the area where single optical sections were selected from (D–D2). B, Scheme of a 48 hpf embryo. The red box marks the area of confocal images in (A). C, For background control, embryo was stained without antibody against PKD1. D, Optical sections of the embryo, where colocalization of nuclear GFP signal in endothelial cells and PKD1 expression is shown. E–J, Cross-sections of a 48 hpf tg(fli1:EGFP) embryo. E, Ubiquitous PKD1 expression (red). F, EGFP expression in the vasculature of a tg(fli1:EGFP) embryo, e.g. in the dorsal aorta (DA), posterior cardinal vein (PCV) and dorsal longitudinal anastomotic vessel (DLAV). G, Merge of (E) and (F). H, Confocal image of a 48 hpf tg(fli1:EGFP) zebrafish embryo confirmed co-localization of EGFP and PKD1 in the PCV, DA and DLAV. I, Bright field image. J, Control section lacking the primary PKD1 antibody revealed no staining. Scale bars: 100 μm (A–D2), 25 μm (E–J). ISV: intersomitic vessel. DLAV: dorsal longitudinal anastomotic vessel. PCV: posterior cardinal vein. |
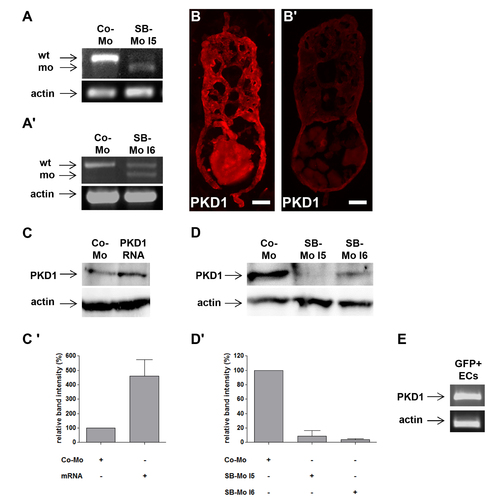
PKD1 expression silencing by two splice-blocking morpholinos and PKD1 mRNA injection in zebrafish embryos. A–A2, Expression silencing of PKD1 in 24 hpf zebrafish embryos using two splice-blocking morpholinos (SB-Mo I5 and I6). RT-PCR analysis of 2 ng control morpholino (Co-Mo) and 500 pg SB-Mo I5 (A) or 500 pg SB-Mo I6 (A2) injected embryos. The upper signal represents the wild-type (wt), the lower signal the morphant (mo) product. Injection of SB-Mo I5 or I6 generated a substantial loss of the wild-type splice product indicating the functionality of both PKD1 morpholinos. B–B2, PKD1 antibody stainings of cross-sections of 48 hpf embryos injected with CoMo (2 ng) (B) or SB-Mo I5 (500 pg) (B2) indicated reduced PKD1 expression (red colour) in PKD1 morphant embryos. Exposure time was 840 ms for all images. C, Injection of 100 pg human PKD1 sense RNA into zebrafish embryos led to an enhanced expression of PKD1 protein. C2, Quantification of (C) by densitometry, showing three independent experiments with S.D. D, Western blot analysis of 24 hpf embryos after injection of SB-Mo I5 (500 pg) or SB-Mo I6 (500 pg) indicated strong reduction in PKD1 protein expression as compared to Co-Mo - injected (2 ng) embryos. D2, Quantification of (D) by densitometry, results represent means of three independent experiments with S.D. E, Expression of PKD1 in tg(fli1:EGFP) zebrafish endothelial cells at 24 hpf as shown by RT-PCR of EGFP purified endothelial cells. Scale bars: 25 μm. |
PKD1 silencing in zebrafish did not alter cranial angiogenesis. A–C2, 24 hpf (A, B, C) and 48 hpf (A2, B2, C2) tg(fli1:EGFP) zebrafish embryos were analyzed for defects in the primordial hindbrain channel (PHBC, arrows) and central arteries (CA, asterisks) by confocal microscopy. Injection of 500 pg SB-Mo I5 (B, B2) or 500 pg SB-Mo I6 (C, C2) did not reveal vascular defects in the cranial vasculature as compared to 2 ng Co-Mo injected tg(fli1:EGFP) zebrafish embryos (A, A2). Black scale bars: 500 μm, red scale bars: 50 μm. |
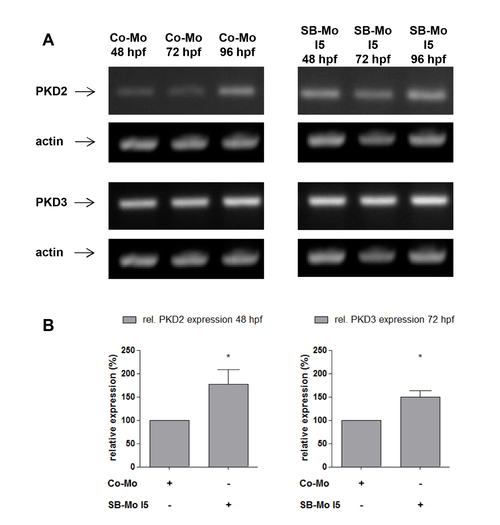
Expression of PKD2 and PKD3 in PKD1 morphants. A, RT-PCR expression analysis for PKD2 and PKD3 after PKD1 silencing in zebrafish using SB-Mo I5. Injection of SB-Mo I5 (500 pg) led to a weak increase of PKD2 and PKD3 expression at 48 hpf, 72 hpf and 96 hpf. B, Quantification of selected timepoints of (A) by densitometry; data represent means of three independent experiments with S.D. *P<0.05, **P<0.01, ***P<0.001. |
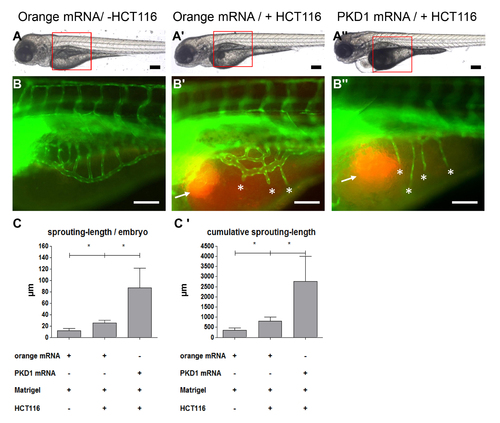
Increased tumor angiogenesis in tg(fli1:EGFP) zebrafish embryos overexpressing PKD1. Overall morphology of orange-mRNA - injected (100 pg) or PKD1 mRNA - injected (100 pg) 96 hpf embryos. At 48 hpf 1–4 nl of Matrigel (A, B) or Matrigel/HCT116 solution (A2, A3, B2, B3) was injected in the perivitelline space. Red boxes indicate regions of pictures shown in (B–B3). B–B3, HCT116 induced tumor angiogenesis as indicated by sprouting of subintestinal venous plexus (SIV) was analyzed at 96 hpf in tg(fli1:EGFP) embryos. Injection of HCT116 tumor cells (labeled with VybrantDil in red, arrow) led to a strong formation of ectopic blood vessels originated from the SIV (asterisks). In PKD1 overexpressing embryos ectopic blood vessel formation was further enhanced. C–C2, Quantification of sprouting length per embryo (C) and cumulative sprouting length (C2) with S.D. of at least 30 embryos per group. For cumulative sprouting-length all sprouts of the same number of embryos per group were summed, (C2) represents means of three independent experiments with S.D. Black scale bars: 300 μm; white scale bars: 100 μm. *P<0.05, **P<0.01, ***P<0.001. |
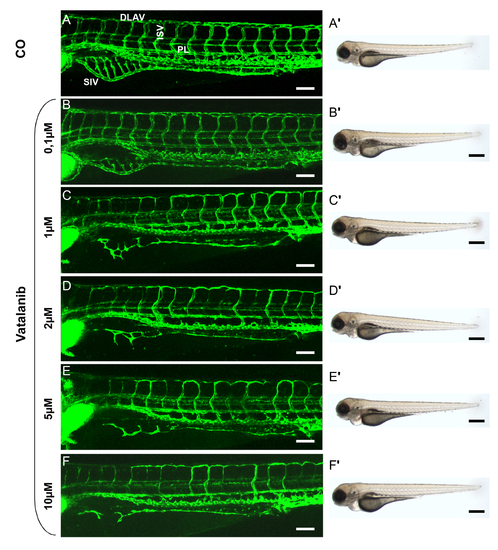
Effect of Vatalanib treatment on vascular development of the trunk vasculature in zebrafish embryos and overall morphology. A–F2, tg(fli1:EGFP) zebrafish embryos were treated with Vatalanib in different concentrations for 48 hours, beginning at 48 hpf. Confocal images of trunk vasculature (A–F) and light images of overall morphology (A2–F2) were taken at 96 hpf. Embryos were incubated with control solution (0.05% DMSO in eggwater equal to the DMSO concentration in 10 μM Vatalanib treated embryos) (A, A2), 0,1 μM Vatalanib (B, B2), 1 μM Vatalanib (C, C2), 2 μM Vatalanib (D, D2), 5 μM Vatalanib (E, E2) and 10 μM Vatalanib (F, F2). ISV = intersomitic vessel, SIV = subintestinal vein plexus, PL = parachordal lymphangioblasts, DLAV = dorsal longitudinal anastomotic vessel. White scale bar: 100 μm; black scale bar: 500 μm. |