
- Title
-
Cyclin-dependent kinase inhibitor p20 controls circadian cell-cycle timing
- Authors
- Laranjeiro, R., Tamai, T.K., Peyric, E., Krusche, P., Ott, S., and Whitmore, D.
- Source
- Full text @ Proc. Natl. Acad. Sci. USA
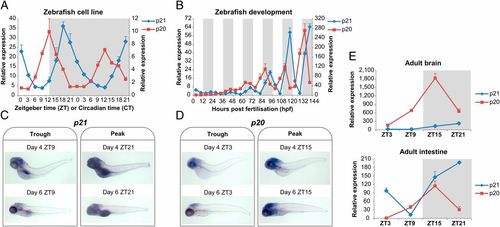
Differential rhythmic expression of p21 and p20. qPCR analysis of p21 and p20 expression in PAC2 cells (A) and during embryo development (B). The left and right axes correspond to relative levels of p21 and p20, respectively. Representative images of whole mount in situ hybridization on 4- and 6-d-old larvae for p21 (C) and p20 (D). Both trough and peak times were analyzed. (E) qPCR analysis of p21 and p20 expression in adult zebrafish tissues (brain and intestine). White and gray backgrounds represent light and dark phases, respectively. |
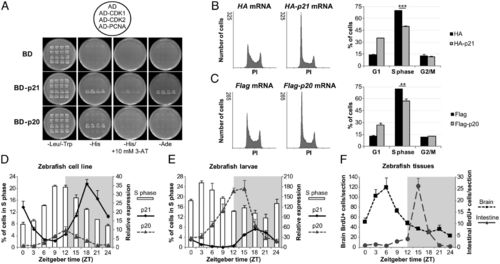
p20 regulates circadian cell-cycle timing by inhibiting the G1/S transition. (A) Yeast two-hybrid analysis of p21 and p20 interactions with CDK1, CDK2, and PCNA. Four independent transformants from each plasmid combination were selected on Leu/Trp media. Protein interactions were assayed on –His, His/+10 mM 3-AT, and –Ade media. (B) Representative histograms of DNA content from embryos at 70–80% epiboly injected with 60 pg/embryo of HA or HA-p21 mRNA at the single-cell stage (Left). Cell-cycle distribution of the same embryo samples determined by the Watson Pragmatic Model (Right). (C) Representative histograms of DNA content from embryos at 70–80% epiboly injected with 40 pg/embryo of Flag or Flag-p20 mRNA at the single-cell stage (Left). Cell-cycle distribution of the same embryo samples determined by the Watson Pragmatic Model (Right). **P < 0.01, ***P < 0.001. qPCR analysis of p21 and p20 expression plotted against the percentage of cells in S phase in PAC2 cells (D) and in 6-d-old larvae (E). (F) Quantification of BrdU-positive cells present in cross-sections of the hindbrain and the intestinal bulb of 6-d-old larvae. For each time point, three independent larvae were analyzed for a total of 12 sections. White and gray backgrounds represent light and dark phases, respectively. |
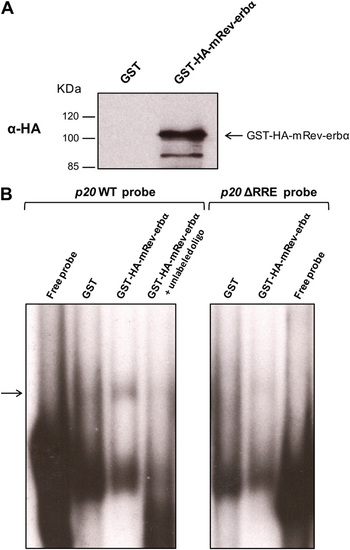
Rev-Erbα binds to the RRE in the p20 promoter. (A) Western blot analysis of BL21 bacterial cells expressing either GST or GST-HA-mRev-erbα using an anti-HA antibody. (B) Electrophoretic mobility shift assay using a 32P-labeled DNA fragment of the p20 promoter containing (p20 WT probe) or lacking (p20 ΔRRE probe) the RRE sequence. Arrow indicates a specific shift observed only for the p20 WT probe in the presence of Rev-Erbα. Unlabeled oligo containing the p20 RRE competes with binding to the labeled probe. |
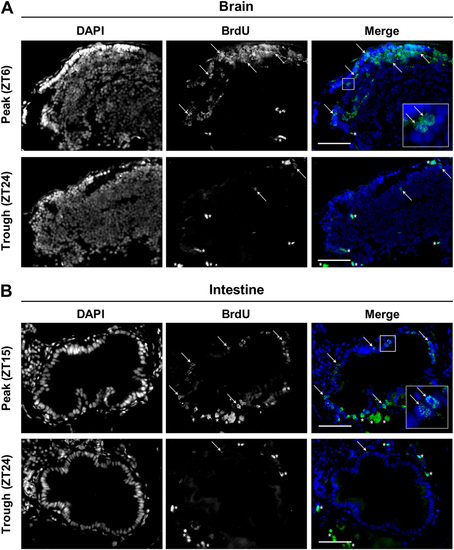
The peak in S phase occurs at different times of the day in different zebrafish tissues. Representative cross-sections of larval brain (A) and intestine (B) immunostained for BrdU. DAPI was used as a nuclear counterstaining. Images corresponding to peak and trough times are shown for both tissues. Insets show higher magnification of the boxed areas. Arrows indicate examples of BrdU-positive cells (punctate nuclear staining). Asterisks indicate nonspecific staining. (Scale bar, 50 μm.) |