
Image
|
Figure Caption
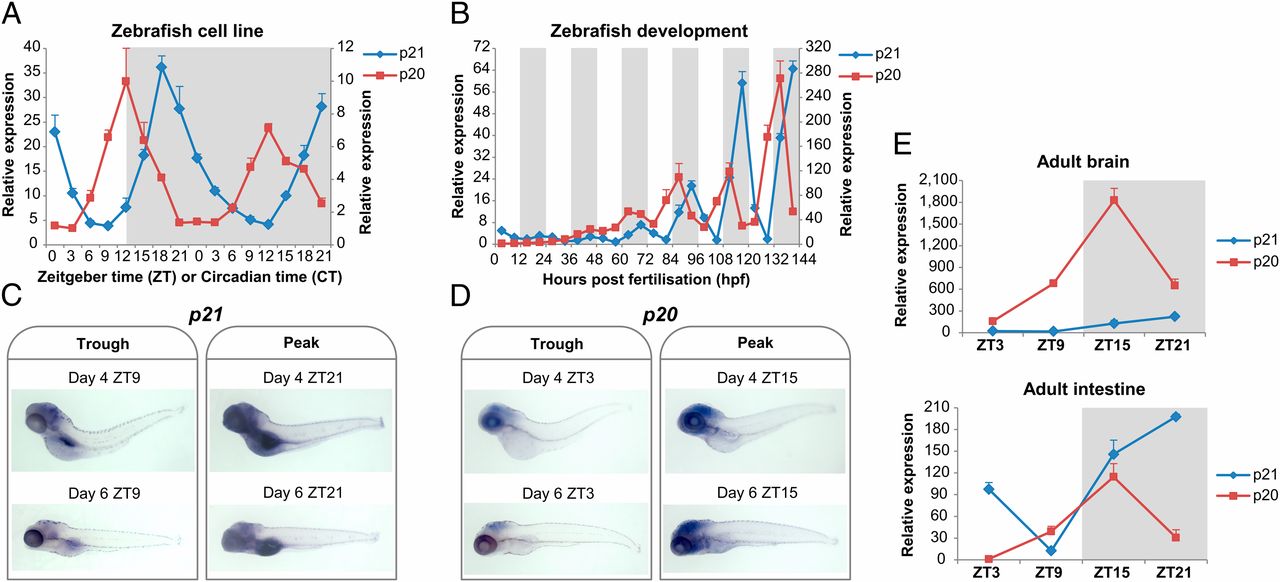
Fig. 2
Differential rhythmic expression of p21 and p20. qPCR analysis of p21 and p20 expression in PAC2 cells (A) and during embryo development (B). The left and right axes correspond to relative levels of p21 and p20, respectively. Representative images of whole mount in situ hybridization on 4- and 6-d-old larvae for p21 (C) and p20 (D). Both trough and peak times were analyzed. (E) qPCR analysis of p21 and p20 expression in adult zebrafish tissues (brain and intestine). White and gray backgrounds represent light and dark phases, respectively.
Acknowledgments
This image is the copyrighted work of the attributed author or publisher, and
ZFIN has permission only to display this image to its users.
Additional permissions should be obtained from the applicable author or publisher of the image.
Full text @ Proc. Natl. Acad. Sci. USA