
- Title
-
HCV IRES-Mediated Core Expression in Zebrafish
- Authors
- Zhao, Y., Qin, W., Zhang, J.P., Hu, Z.Y., Tong, J.W., Ding, C.B., Peng, Z.G., Zhao, L.X., Song, D.Q., and Jiang, J.D.
- Source
- Full text @ PLoS One

Expression of Core and GFP in zebrafish larvae. A. Diagrams of plasmid constructs. In pFL-GIC the core cds and GFP cds are driven by L-FABP enhancer and HL promoters, and separated by HCV IRES residing between them. pFL-G was a control construct without HCV IRES-core sequence. B. Observation of expression of GFP in 8-dpf zebrafish larvae under a flourescence microscopy. In each group, upper panel shows larvae images under the GFP excitation filter; lower panel shows the same larvae under visible light. Positive bright green fluorescence was seen in liver of the larvae injected with pFL-GIC or pFL-G, but in WT larvae only the auto-fluorescence appeared with yellowish fluorescence. Red Arrows indicate liver region in the larvae. A GFP filter (480 nm excitation, 505 nm emission) were used to excite the EGFP (Green). Original images were 40×. C. RT-PCR assay for transcription of core and gfp in pFL-GIC injected larvae, compared to that of pFL-G injection and that of wildtype larvae; β-actin was used as a loading control. All the larvae in this assay were collected at 10 dpf. D. Western blotting Assay for CORE and GFP proteins in pFL-GIC injected larvae, compared to that of pFL-G injection and that of wildtype larvae; β-ACTIN was used as a loading control. All the larvae in this assay were collected at 10 dpf. |
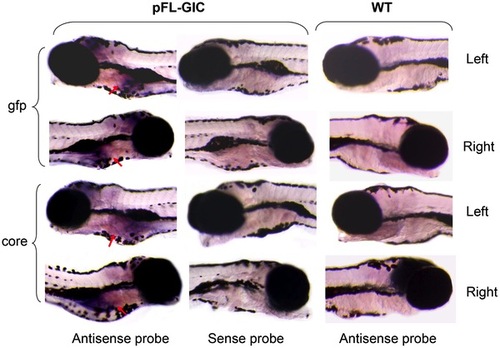
HCV core and gfp expression in zebrafish liver. Whole mount in situ hybridization was carried out on 8-dpf larvae using antisense or sense RNA probes of core and gfp, respectively. The core and gfp signals were mainly occurred in liver area in pFL-GIC injected larvae at 8-dpf with antisense probes (red arrows), and were not seen in WT larvae and in the sense probe group with pFL-GIC injection as a negative control. Original images were 40×. |

Time-dependent expression of HCV core and gfp during the early larva stage. A. Transcription level of core and gfp in pFL-GIC injected zebrafish larvae at 3-, 6- and 9-dpf was examined by RT-PCR. β-actin was used as a loading control. The band semiquantitative density scanning was done and normalized by β-actin signal for their transcriptional level evaluation (the right histogram. * p<0.05, ** p<0.01). B. Translation level of CORE and GFP in pFL-GIC injected larvae was detected with Western blotting at 3-, 6- and 9-dpf. β-ACTIN was used as a loading control. The bands of CORE and GFP were scanned and normalized by β-ACTIN signal for their protein level evaluation (the right histogram. * p<0.05). |

Expression of liver pathological marker genes responded to HCV core expression in the HCV-zebrafish model. RT-PCR was used to assess the gene expression in pFL-GIC- and pFL-G-injected larvae and in WT larvae at 6-dpf and 9-dpf. A. Result of genes involved in fat liver, steatohepatitis and fibrosis; B. HCV-infection associated genes. WT as a normal control and pFL-G as a vehicle control injection. |
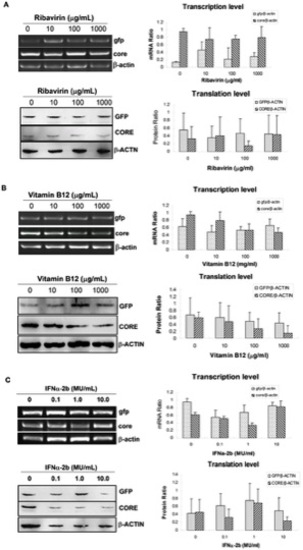
Verification for the efficiency of the HCV IRES-mediating expression zebrafish model with anti-HCV drugs. RT-PCR (upper panel) and Western blotting (lower panel) were used for detecting expression of core and gfp in pFL-GIC-injected larvae that were exposed to ribavirin (A) and vitamin B12 (B) drugs at gradient concentrations from 5-dpf to 10 dpf. C. Result of IFNα-2b co-injected with plasmid pFL-GIC. All the larvae were collected at 10-dpf for RT-PCR and Western blotting assays. Untreated larvae were as a control. Both cDNA and protein bands were scanned against β-actin cDNA or β-ACTIN protein respectively for semiquantitative evaluation of core and gfp expression (right histograms). |
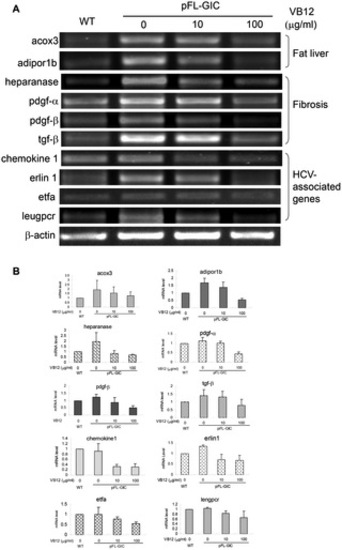
Down-regulation of liver pathological gene mRNA levels by vitamin B12 exposure. Zebrafish larvae with pFL-GIC injection were exposed in vitamin B12 from 5 dpf to 8 dpf, and collected for detection of the pathological gene mRNA levels by RT-PCR. Target gene bands were scanned against β-actin band for semiquantitative evaluation. WT used as a normal control. A. Representative mRNA levels of genes involved in fat liver, fibrosis and HCV-associated genes; B. Histograms for relative variation of mRNA levels that were normalized to WT. |