
- Title
-
The elongation rate of RNA polymerase II in zebrafish and its significance in the somite segmentation clock
- Authors
- Hanisch, A., Holder, M.V., Choorapoikayil, S., Gajewski, M., Ozbudak, E.M., and Lewis, J.
- Source
- Full text @ Development
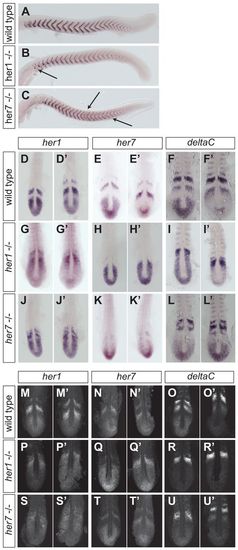
her1-/- and her7-/- embryos show mild defects in somite boundary formation and disturbed expression of oscillatory genes in the PSM. (A-C) Zebrafish embryos fixed at ~24 hpf and stained with cb1045 ISH probe to show somite boundaries (lateral views). (A) Wild type (siblings of her7-/- mutant); (B) her1-/-; (C) her7-/-. Arrows indicate irregularities of segmentation. (D-U′) Expression patterns of her1, her7 and deltaC in wild type, her1-/- and her7-/- as shown by conventional ISH (D-L′) and FISH (M-U′; optical sections). Embryos are at the 10-somite stage (14 hpf) and flat mounted. Two specimens from each cohort are shown to illustrate the oscillatory behaviour. Note that the ISH phenotype, like the segmentation phenotype (supplementary material Fig. S1), varied in severity from one batch of embryos to another (compare K,K′ with T,T′). A total of 243 embryos were stained and assessed, including at least 12 for each gene/genotype combination. |

Wild-type, her1-/- and her7-/- fish form almost identical numbers of vertebrae. Wild-type (A), her1-/- (B) and her7-/- (C) fish stained with calcein to visualise calcified tissues. These fish are 21-28 days old and measure 10-12 mm from head to tail. Most her7-/- fish have skeletal abnormalities affecting their posterior skeleton, such as missing or bifurcated ribs, irregularly sized vertebrae, and malformation and/or misalignment of the neural and haemal spines. her1-/- fish rarely have posterior skeletal defects, but often exhibit defects in their anterior vertebrae (e.g. an extra Weberian vertebra, not visible in this specimen). Mean vertebra counts are the same within 3% for the three genotypes (see Table 1). |
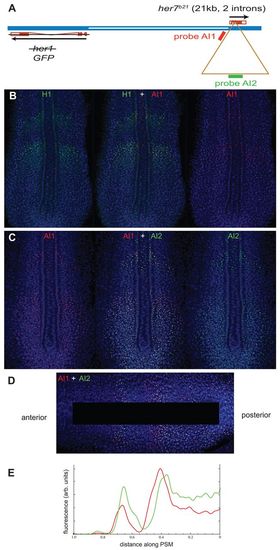
Measurement of the transcription elongation rate in the PSM of an intact embryo using b21 transgenic fish. (A) The modified transgenic her1/7 locus in b21 fish (compare with Fig. 2A). A ~21 kb artificial intron (brown triangle) was inserted in the second intron of her7. Probes AI1 (red) and AI2 (green) recognise regions of this intron that are ~10 kb apart. The her1 coding sequence is replaced by d1EGFP. (B,C) b21 transgenic embryos fixed at the 10-somite stage (14 hpf) and stained by two-colour FISH with two different probes and with DAPI as nuclear counterstain. Confocal optical sections of the PSM of flat-mounted embryos are shown. The middle image is a merge, with red and green channels shown separately on either side. (B) Co-staining with probes H1 (green; detecting transcripts from endogenous her1) and AI1 (red). (C) Co-staining with probes AI1 (red) and AI2 (green). (D) Processed image of the PSM of an embryo co-stained with AI1 and AI2 as used for intensity plot analysis. The image is warped in Adobe Photoshop to make the stripes of gene expression appear at right angles to the body axis, and the notochord and adaxial cells are blanked out leaving only PSM tissue to contribute to the analysis. (E) Intensity of the red and green fluorescence signals as a function of distance along the body axis. For each point along the axis, we took the total signal summed over the transverse column of pixels, and used Gaussian smoothing to obtain a smooth graph. The offset between the red and green signals was measured as the distance between the points of inflection on the rising parts of the curves, and the corresponding timing difference was calculated as described (Giudicelli et al., 2007). |