
- Title
-
Quantitative semi-automated analysis of morphogenesis with single-cell resolution in complex embryos
- Authors
- Giurumescu, C.A., Kang, S., Planchon, T.A., Betzig, E., Bloomekatz, J., Yelon, D., Cosman, P., and Chisholm, A.D.
- Source
- Full text @ Development
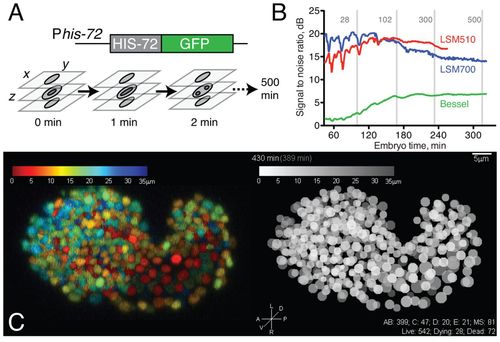
4D data acquisition and image properties. (A) Schematic of acquisition setup. We use laser scanning confocal microscopy to acquire z-stacks every minute for 5 hours of embryo development followed by z-stacks every two minutes for 3 hours at 20-24°C. Acquisition of each stack takes 12-15 seconds at 512 × 275 × 35 voxels. (B) Comparison of signal-to-noise ratio (SNR) of raw data from 4D movies taken using Zeiss LSM510, Zeiss LSM700 and Bessel beam microscopy. Image acquisition was optimized for image quality compatible with viability; under these parameters, the LSM510 and LSM700 data sets showed comparable SNR. (C) Comparison of confocal image (color depth code, projection of LSM700 z-stack, 430 minutes) with digital representation (gray scale depth code). EXPRESSION / LABELING:
|
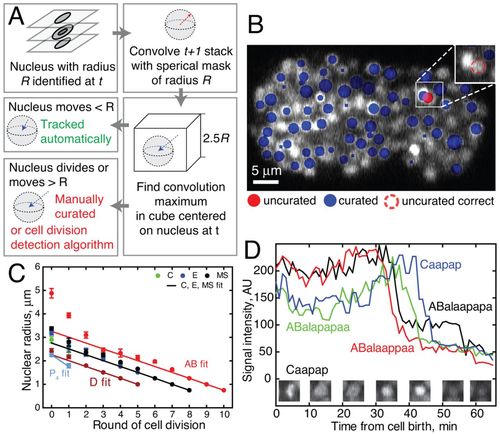
Automated nuclear tracking using local search. (A) Overview of the tracking algorithm in NucleiTracker4D. The tracking component searches the neighboring space of each nucleus identified at t for new convolution signal maxima. Only nuclei not satisfying the automatic tracking condition (e.g. displacement≥R) are prompted for manual curation. (B) An example of a tracking error requiring manual curation. Here, an AB nucleus was mis-tracked towards one of its MS neighbors owing to differing brightness among sublineages. The user corrected position is marked with a dashed red line. (C) Variation in nuclear radii in the major embryonic sublineages. The linear fit is used as a model of nuclear radius in NucleiTracker4D. For early cells (AB, C, E, MS) n≥5 (data from five embryos with a nucleus present in at least one time point); for all other cells, 16≥n≤32, from two embryos with nuclei present for at least two time points. Where more than eight descendants (after third round of division) are present at one time point, cells quantified were picked at random. Error bars represent s.e.m. (D) Apoptotic cells undergo characteristic changes in HIS-72::GFP fluorescence; see supplementary material Movie 3. Nuclei of dying cells are assigned a radius according to the model until signal intensity decreases sharply corresponding to DNA condensation (~25 minutes after cell birth). At this point the dying cell nuclear radius is plotted as a minimal radius (0.5 μm). After another ~20 minutes, the HIS-72::GFP signal decreases as the cell is engulfed. |
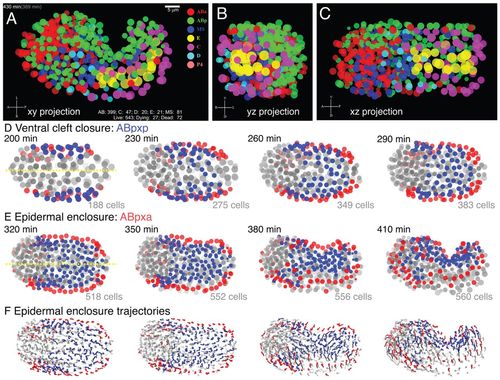
Visualization of late stage C. elegans embryonic morphogenesis with single cell resolution. Visualization of morphogenetic movements from digital 4D movies, focusing on epidermal enclosure. Nuclei are depicted as semitransparent circles (A-E) or as trajectory flow fields (F). (A-C) Orthogonal views of 430-minute embryo; see also supplementary materialMovies 1, 2. Time stamps at upper left denote actual movie time (gray, in parentheses) and estimated time since first cleavage (movie time + 91 minutes). The counters on lower right side show numbers of surviving descendants of each sublineage, total number of live nuclei, dying nuclei (cells undergoing apoptosis but still visible) and dead nuclei (no longer visible). All views are of the same data set from the ventral surface (xy view, A), posterior side (yz, B) and left lateral side (xz, C). Cells are color coded according to lineage origin. (D,E) ABp descendants undergo successive epiboly-like collective movements towards the ventral midline (yellow) during gastrulation cleft closure (200-290 minutes, D) and epidermal enclosure (320-410 minutes, E). ABpxp descendants (blue) are predominantly involved in ventral cleft closure; ABpxa descendants (red) are predominantly involved in epidermal enclosure. Images are every 30 minutes; cell counts include live and dying cells. (F) Flow field of nuclear trajectories during epidermal enclosure; ABpxx lineage coding as in D,E; 15-minute trajectories. |
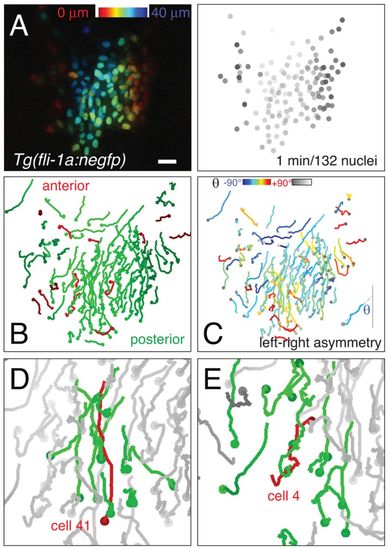
Asymmetric migration patterns of zebrafish endocardial nuclei. (A) Left: Endocardial progenitors labeled with Tg(fli1a:negfp). Dorsal view, posterior is down. Scale bar: 10 μm. Right: Frame from a single confocal movie of 1-minute intervals, together with the corresponding frame of the 132 individual nuclei tracked using NucleiTracker4D. Grayscale depth code reveals dorsal angioblasts (dark gray) at lateral positions. (B) Overall posterior movement of endocardial nuclei; trajectories are color coded according to their net movement along the anterior-posterior axis. (C) Left-right asymmetry of endocardial migration; trajectories are color coded by net angle θ relative to the anterior-posterior axis. In this movie, 88 cells moved leftward and 44 cells rightward. (D) Example of correlated trajectories of a target cell (cell 41) and its nearest neighbors. (E) Example of target cell (cell 4) moving in the opposite direction to its neighbors. |