
- Title
-
Development and validation of an automated high-throughput system for zebrafish in vivo screenings
- Authors
- Letamendia, A., Quevedo, C., Ibarbia, I., Virto, J.M., Holgado, O., Diez, M., Izpisúa Belmonte, J.C., and Callol-Massot, C.
- Source
- Full text @ PLoS One
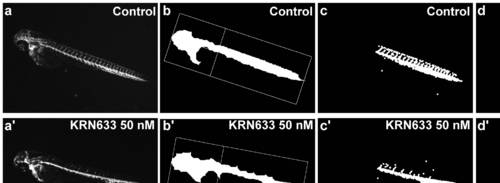
Images analysis for ISVs formation. The figure shows the different steps in the process of image analysis for the determination of the anti-angiogenesis effect. Control embryo (A, B, C and D); embryo treated with KRN633 (A′, B′, C′ and D′). (A) and (A′) are the original images acquired by the microscope; (B) and (B′) are images showing the segmentation between the head and the tail of the embryo to separate the ROI and measure the length; (C) and (C′) are images corresponding to an intermediate step in the filtering process where all the vessels in the tail can be identified; (D) and (D′) are images presenting the area enclosed between ISVs and DLAVs (in white) that are the ones to be quantified. |
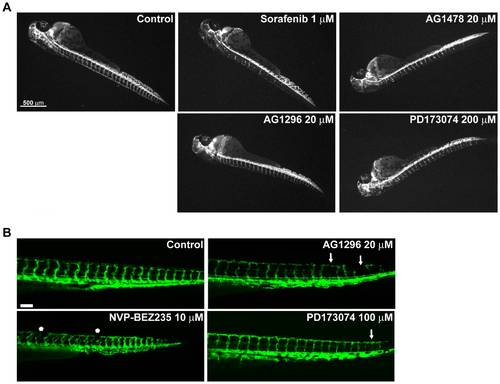
Two different phenotypes induced by angiogenesis inhibitors. 24 hpf zebrafish embryos were treated with different inhibitors and checked for angiogenesis defects at 48 hpf (A) or at 72 hpf (B) as described in material and methods section. (A) Representative fluorescent images of embryos treated with inhibitors that alter the development of ISVs at the level of sprouting and extension (superior panel) or that perturb later stages of maturation and/or DLAV formation (lower panel). Compared with control ones, treated embryos present a lower number of incomplete ISVs in the case of Sorafenib and AG1478 while AG1296 and PD173074 inhibit proper development of the DLAV and the ISVs looks thinner. (B) Representative fluorescent images of embryos treated with the indicated inhibitors showing the presence of thinner ISVs, some of them disrupted (arrows) and interrupted DLAV formation (asterisks). |