
|
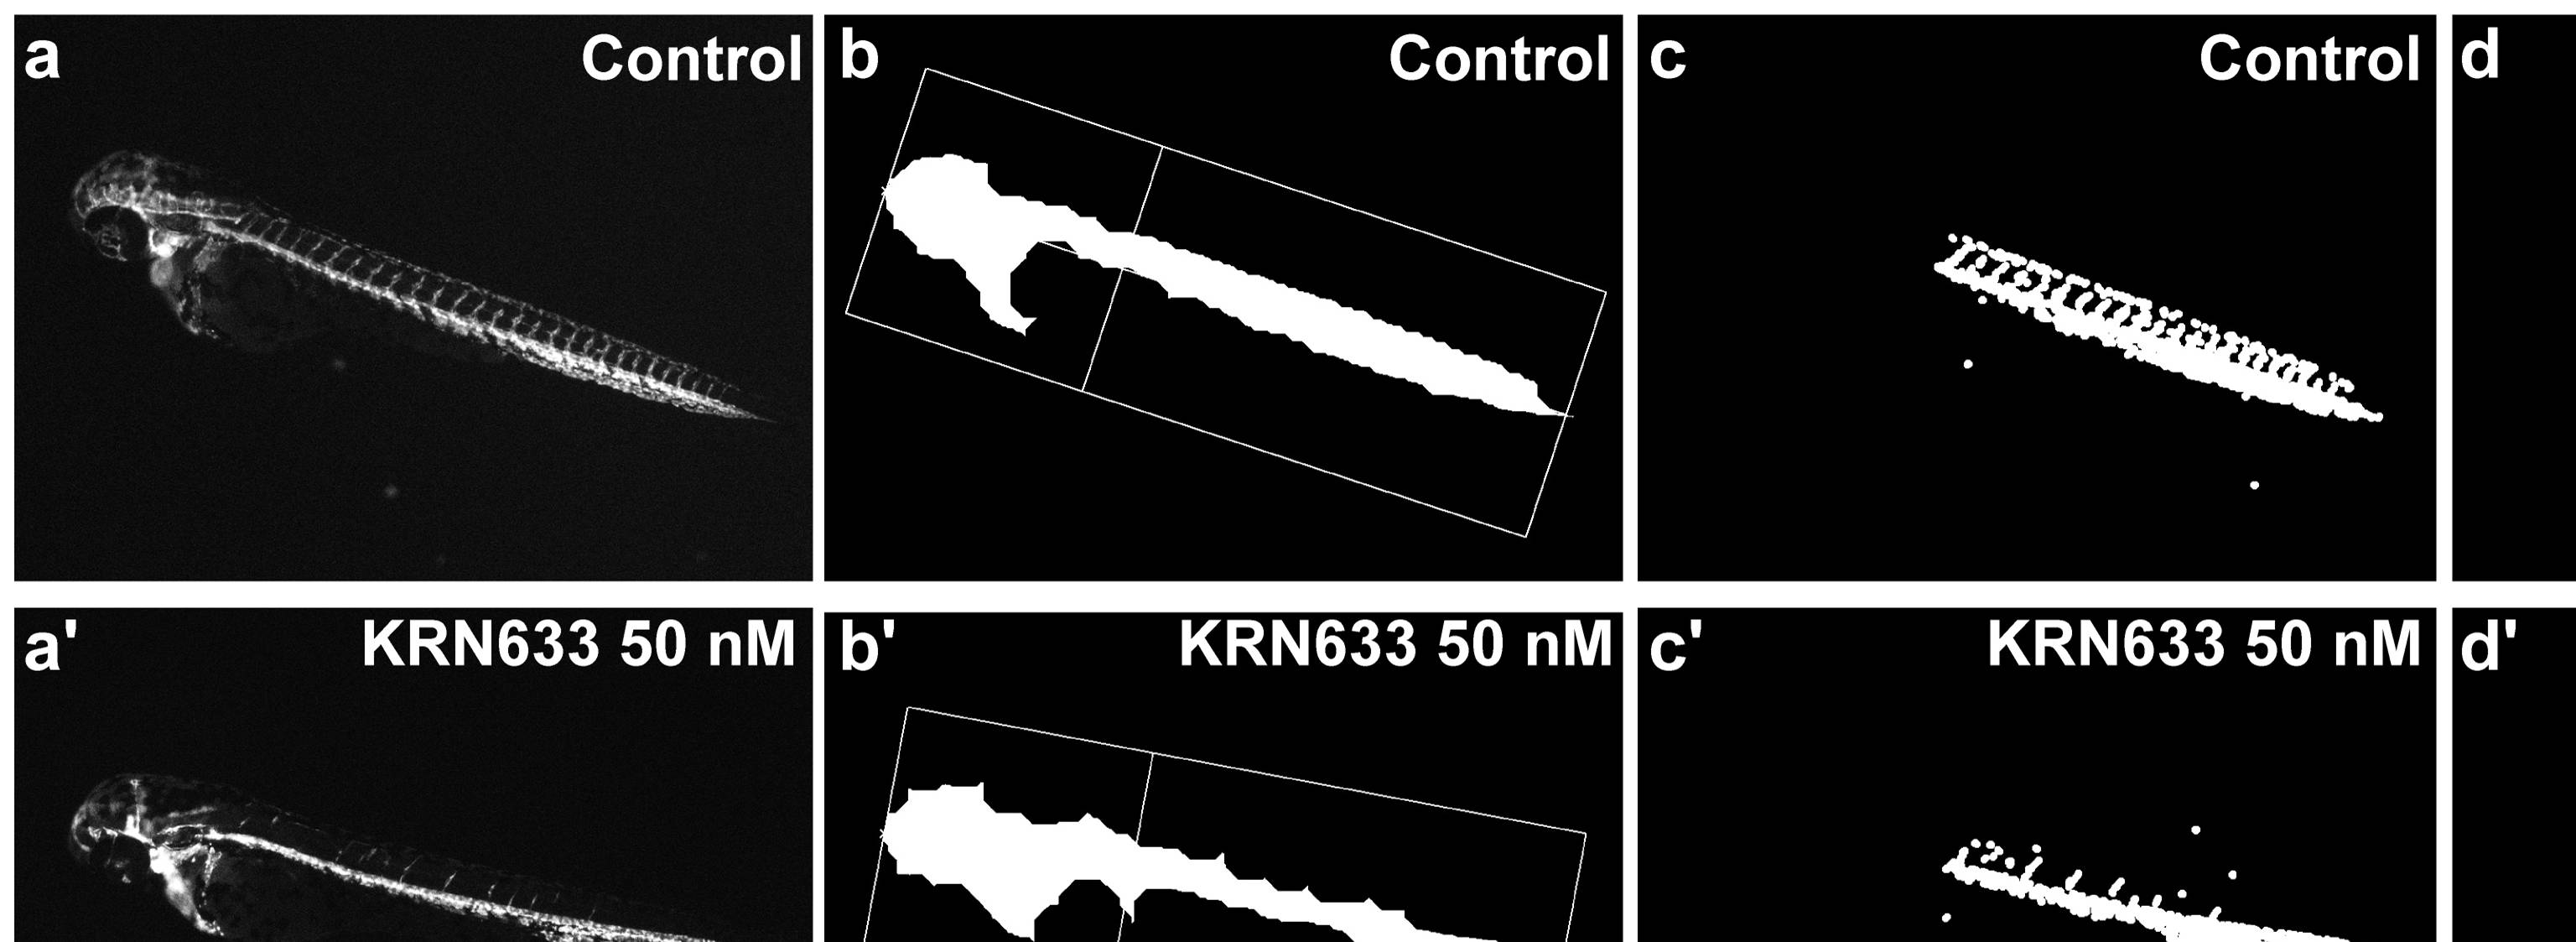
Fig. 4 Images analysis for ISVs formation.
The figure shows the different steps in the process of image analysis for the determination of the anti-angiogenesis effect. Control embryo (A, B, C and D); embryo treated with KRN633 (A′, B′, C′ and D′). (A) and (A′) are the original images acquired by the microscope; (B) and (B′) are images showing the segmentation between the head and the tail of the embryo to separate the ROI and measure the length; (C) and (C′) are images corresponding to an intermediate step in the filtering process where all the vessels in the tail can be identified; (D) and (D′) are images presenting the area enclosed between ISVs and DLAVs (in white) that are the ones to be quantified.