
- Title
-
Miniaturized Embryo Array for Automated Trapping, Immobilization and Microperfusion of Zebrafish Embryos
- Authors
- Akagi, J., Khoshmanesh, K., Evans, B., Hall, C.J., Crosier, K.E., Cooper, J.M., Crosier, P.S., and Wlodkowic, D.
- Source
- Full text @ PLoS One

Validation of embryo microperfusion and drug delivery inside the chip: A) Microphotograph showing a single immobilized zebrafish embryo (circa 16 hpf); B) 3D streamlines of fluid around the embryos colored by flow velocity (m/s) obtained by computational fluid dynamic simulations as the fluid enters two traps occupied by docked embryos. Perfusion was simulated at a volumetric flow rate of 0.4 ml/min; C) Mass transfer across the simulated (upper panel) and real-world (lower panel) microfluidic array fully loaded with zebrafish embryos. Chip was perfused with a 0.04% Trypan Blue dye at a volumetric flow rate of 0.4 ml/min; D) Experimental analysis of the time needed for a complete dye exchange across the whole device (12 rows) at varying flow rates 0.1–2 ml/min.; E) Validation of the dye delivery to each embryo across the microfluidic array. Chip was perfused with a 0.04% Trypan Blue dye at a volumetric flow rate of 0.4 ml/min for up to 4 minutes. Trypan Blue was then replaced with medium; F) Intensity of dye across each embryo obtained by image analysis of the experiments in E). Red line denotes the average staining intensity. Blue arrows depict the direction of fluid flow and embryo movement along the serpentine channel. |
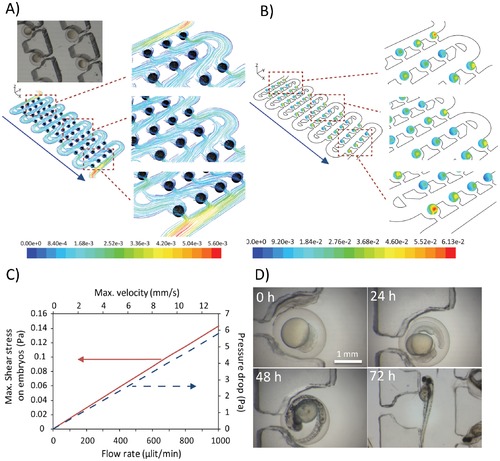
Assessment of microenvironmental conditions inside the chip: A) 3D streamline of flow obtained by computational fluid dynamic simulations across the fully loaded device. Perfusion was simulated at a volumetric flow rate of 0.4 ml/min; B) Contours of shear stress (Pa) exerted on embryos across the whole device. There sections of the chip (upper, middle and lower part) are magnified for clarity. Perfusion was simulated at a volumetric flow rate of 0.4 ml/min; C) Performance curves of the chip as a function of the volumetric flow rate; D) Time-lapse images of developing zebrafish embryos collected every 24 hours. Embryos were loaded on a chip at the volumetric flow rate of 2 ml/min. Subsequently the chip was perfused at a rate of 0.4 ml/min for up to 72 hours. |

On-chip angiogenesis assay using transgenic zebrafish line: A) The transgenic fli1a:EGFP embryos at 16 hpf were loaded, immobilized and continuously perfused on a chip with E3 media containing vehicle control (DMSO); B) The transgenic fli1a:EGFP embryos at 16 hpf were loaded, immobilized and continuously perfused on a chip with a 1 μM of selective VEGFR inhibitor AV951 (Tivozanib, AVEO Pharmaceuticals Inc). Fluorescent and brightfield images were acquired at 0, 24 and 48 hours intervals. The optical transparency of embryos coupled with hydrodynamic immobilization on a chip array allowed for convenient microscopic visualization of characteristic patterns of intersegmental vessels (ISV, white arrows) and their AV951-induced inhibition (red arrows); C) Fli1a:EGFP transgenic embryos arrayed and hydrodynamically immobilized on a chip-based device. Developing patterns of intersegmental vessels are clearly visible even at the low magnification. Inset shows high magnification of hatched fli1a:EGFP larva with fully developed pattern of vasculature (white arrows). |
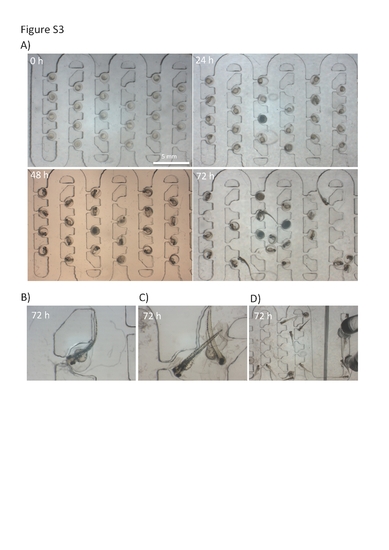
Assessment of embryo development inside the chip. A) Time-lapse images of developing zebrafish embryos collected every 24 hours. Embryos were loaded on a chip at the volumetric flow rate of 2 ml/min. Subsequently the chip was perfused at a rate of 0.4 ml/min for up to 72 hours. Only six rows are shown due to the limitation of the imaging stereoscopic system. Note the normal and very uniform development of embryos hydrodynamically immobilized on the microfluidic array; B–D) Microphotographs of hatched eletheuro-embryos at 72+ hours on a chip. Note that chip design offers the capability to recover both embryos and also swimming eletheuro-embryo stages. The recovery is best performed at the reversed flow rate when hatched stages can be collected from the inlet port. Otherwise the hydrodynamic forces will overcome the swimming behaviour and attract eletheuro-embryos back to the trapping region as denoted in D and E. |