
- Title
-
The Her7 node modulates the network topology of the zebrafish segmentation clock via sequestration of the Hes6 hub
- Authors
- Trofka, A., Schwendinger-Schreck, J., Brend, T., Pontius, W., Emonet, T., and Holley, S.A.
- Source
- Full text @ Development
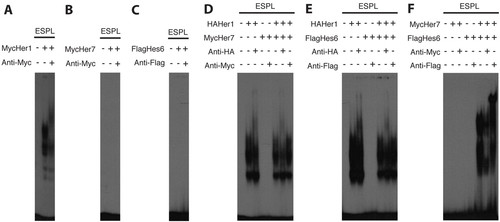
Her proteins form specific DNA-binding dimers in vitro. (A-C) EMSA showing that Her1 by itself, presumably as a homodimer, binds DNA (A), whereas Her7 and Hes6 do not bind DNA by themselves (B and C, respectively). (D-F) Her1 does not detectibly heterodimerize with Her7 (D) or Hes6 (E), but Her7 and Hes6 are able to form a heterodimer (F) based on the presence and shifting of bands with each respective antibody when the two proteins are combined. |
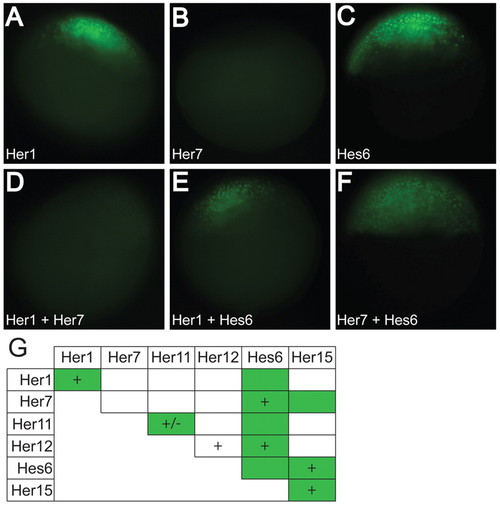
Her proteins form DNA-binding and non-DNA-binding dimers in vivo. (A-F) Representative images of Her1 (A), Her7 (B), Hes6 (C), Her1+Her7 (D), Her1+Hes6 (E) and Her7+Hes6 (F) proteins. (G) A chart summarizing the dimers that bind DNA in vitro (denoted by a +) and the dimers that form in vivo (denoted by a green box). All the dimers observed in vitro, except Her12/Her12, were observed in vivo in addition to the presence of four novel dimers. (+/–) Her11 weakly binds DNA, and although we have observed binding in multiple independent experiments, we frequently did not detect the faint gel shift. |
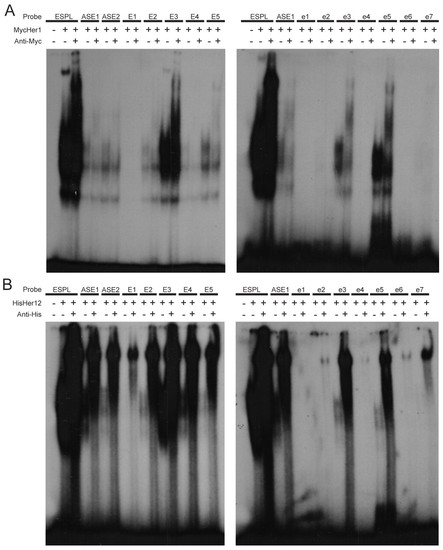
Different Her dimers preferentially bind specific E boxes. (A,B) EMSA of Her1 (A) and Her12 (B) homodimers binding to the five consensus (E1-E5) and seven non-consensus (e1-e7) E boxes upstream of her7. The Her1 homodimer binds to E2, E3, E4, E5, e3 and e5, whereas the Her12 homodimer binds to E1, E2, E3, E4, E5, e2, e3, e4, e5, e6 and e7. |
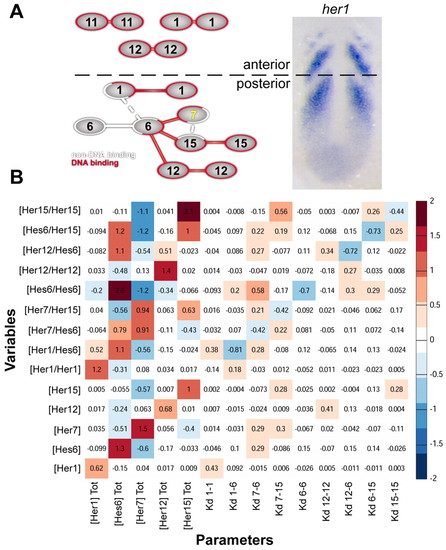
Sensitivity analysis of the dimer network. (A) Schematic of Her dimer network. DNA-binding dimers are connected in red, non-DNA-binding dimers are connected in white. Networks present in the anterior or posterior PSM are segregated and indicated on the wild-type expression of her1. Weak dimers are connected by dashed lines. (B) Summary of local sensitivity analysis of posterior PSM Her/Hes network. Input parameters (total protein concentration and Kd) are listed along the bottom and output variables (Her monomer and dimer concentrations) along the left. Sensitivity values were calculated as the fractional change in each output variable (y) for a given fractional change in the corresponding input parameter (x), to give (Δy/y)/(Δx/x), averaged across 1000 randomly sampled parameter values. Red values indicate a positive relationship, whereas blue values indicate a negative relationship between changes in parameter value and effects on Her concentration. For example, a 1% increase in total Hes6 concentration decreases Her7/Her15 by 0.56%. |
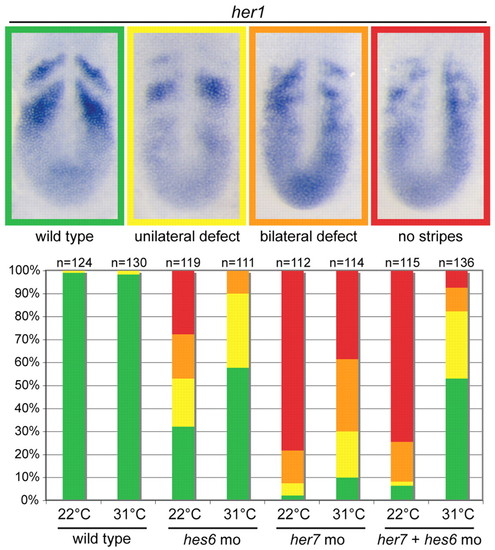
Knockdown of hes6 rescues segmentation clock defects due to knockdown of her7. Representative images are provided for four categories of her1 expression with the color coding corresponding to the histogram. The histogram displays the distribution of the four categories of her1 expression observed in single and double knockdown experiments performed at 22°C and 31°C. The her7 knockdown phenotype is stronger than the hes6 knockdown, and although both are temperature sensitive, the hes6 phenotype is much more affected by temperature. The only condition in which her7 knockdown results in a significant proportion of wild-type segmentation clock patterns is the her7+hes6 double knockdown at 31°C. |
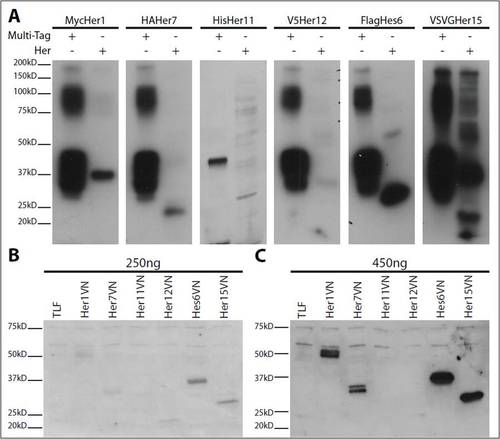
Western blots show proteins for EMSA and BiFC experiments. (A) Western blots for HAHer1, MycHer7, VSVGHer11, HisHer12, FlagHes6 and V5Her15. Expected sizes for EMSA constructs are: HAHer1, 38 kDa; MycHer7, 25 kDa; VSVGHer11, 32 kDa; HisHer12, 19 kDa; FlagHes6, 26 kDa; V5Her15, 20 kDa. All of the proteins run at about the expected size. Note that each protein synthesis reaction gives different levels of protein for the different Her constructs. (B) Western blot of TLF uninjected control and 250 ng RNA injections of Her1VN, Her7VN, Her11VN, Her12VN, Hes6VN and Her15VN. (C) Western blot of TLF uninjected control and 450 ng RNA injections of Her1VN, Her7VN, Her11VN, Her12VN, Hes6VN and Her15VN. Expected sizes for BiFC constructs are: Her1VN, 54 kDa; Her7VN, 41 kDa; Her11VN, 48kD; Her12VN, 35 kDa; Hes6VN, 42 kDa; Her15VN, 35 kDa. All of the proteins run at the expected size except Her12VN, which runs smaller and weaker. This result is consistent across several injections. Her11VN was never visualized on the blot despite exhibiting strong BiFC fluorescence at 400 ng/μl injections. The Multi Tag protein (abcam: ab36791) is a recombinant protein containing the epitope tags (GST, T7, HSV, c-myc, VSV, Glu-Glu, V5, E-tag, DYKDDDDK, S-tag, HA, 6×His) for use on western blots to estimate concentration of epitope-tagged proteins of interest. |
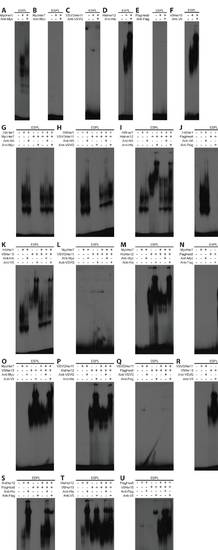
Her dimers detected via EMSA. (A-F) Homodimer analysis for Her1 (A), Her7 (B), Her11 (C), Her12 (D), Hes6 (E) and Her15 (F). Only three our of six Her proteins form detectable homodimers. It is possible that Her11 forms a homodimer, but DNA binding is much weaker than the others and was not present in every gel. (G-U) All combinations of heterodimers: for Her1+Her7 (G), Her1+Her11 (H), Her1+Her12 (I), Her1+Hes6 (J), Her1+Her15 (K), Her7+Her11 (L), Her7+Her12 (M), Her7+Hes6 (N), Her7+Her15 (O), Her11+Her12 (P), Her11+Hes6 (Q), Her11+Her15 (R), Her12+Hes6 (S), Her12+Her15 (T), Hes6+Her15 (U). For Her1+Her12 (I), Her1+Her15 (K) and Her12+Her15 (T), the formation of heterodimers was being assayed for two proteins that form homodimers. In each of these cases, the pattern of dimerization appeared to be additive between the two homodimers, and no novel band or gel shift was detected. |
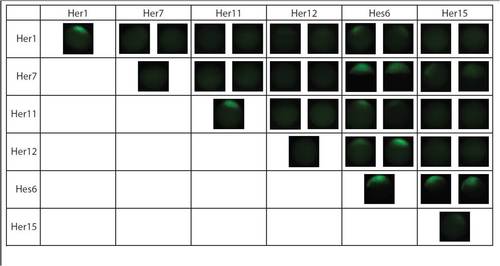
Her dimers detected via BiFC. The chart shows the 10 of 21 Her combinations that dimerize in vivo. The first image in each cell is of the fusion to the N-terminal half of Venus YFP and the second is of the C-terminal half of Venus YFP for the Her protein indicated in the column header. Homodimers are observed along the diagonal. Some dimers appear weaker then others (Her1, Her1+Hes6, Her11+Hes6, Her7+Her15) and were detected only at higher expression levels. |
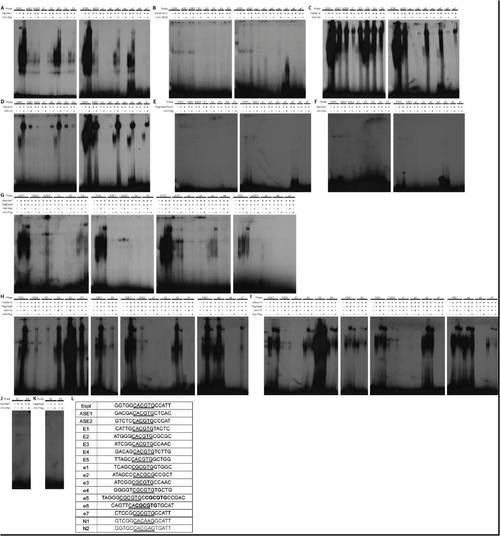
Her dimer binding to putative E boxes upstream of her7. (A-F) All homodimers determined previously to bind DNA Her1 (A), Her11 (B), Her12 (C), Her15 (D) were examined to determine whether they bind 11 E-boxes in the 3.7 kb of genomic sequence upstream of her7. Hes6VN+Hes6VC (E) was examined to ascertain whether stabilization of the Hes6 homodimer by the Venus BiFC would allow DNA binding. We also tested Her7 (F) to see whether it can bind to any of the E-boxes as a presumptive homodimer. (G-I) The Her7+Hes6 (G), Her12+Hes6 (H) and Her15+Her6 (I) heterodimers were tested for binding to the E-boxes. The Espl probe was excluded from the Her12+Hes6 and Her15+Her6 gels because the signal was too strong relative to the other E-boxes tested. These gels are representative and when exposed to film for longer times, weaker bands can be observed, as summarized in the chart in Fig 3C. (J,K) We tested the ability of Her7 (J) and Hes6 (K) to bind to the N-boxes using EMSA. No specific binding is observed. (L) A table of the E-box and N-box sequences for each probe. The E-box or N-box is underlined or in bold. e5 and e6 have 2 E-boxes close enough that they could not be resolved into separate probes and were therefore left together. |