
- Title
-
Extracting fluorescent reporter time courses of cell lineages from high-throughput microscopy at low temporal resolution
- Authors
- Downey, M.J., Jeziorska, D.M., Ott, S., Tamai, T.K., Koentges, G., Vance, K.W., and Bretschneider, T.
- Source
- Full text @ PLoS One

Magnified section of an image obtained from the Cellomics automated microscope. A) C2C12 cells labelled with Hoechst stain. B) Same view showing expression of GFP driven by a Msx1 promoter. GFP expressing cells have been highlighted in yellow in A and B. C) Potential ambiguity in linking cells in subsequent frames (white outlines). Arrows represent potential trajectory assignments with numbers representing the calculated score for each potential assignment. D and E) Cell divisions exhibiting chromatin condensation close to the point of division. Time is displayed in minutes. Scale bar in all images is 50 microns. (C and D have been adapted from [24]. |

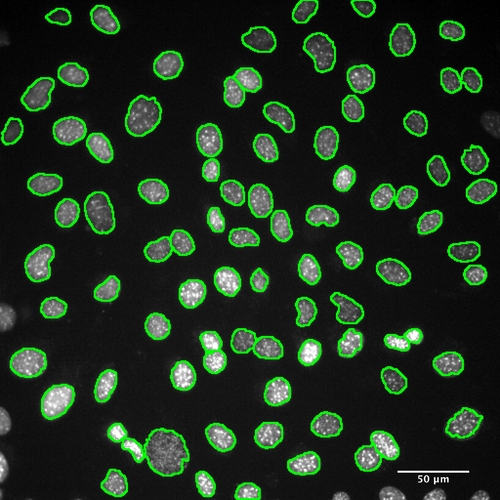
Segmentation of cell nuclei. A) Original nuclei (scale bar 50 microns) taken from the gold standard data set, cell density 1150 cells/mm2. B–H) Nuclei with segmentation examples overlaid. Ellipses indicate segmentation errors. Lines indicate unresolved clusters of cells. B) Manually marked cell position. C) Cellomics segmentation. D) Seeded Growth. E) Global Threshold. F) Local Threshold. G) Scaling Index. H) CellProfiler. I) Cell detection accuracy measurements: Total cell count, false negatives and false positives comparing different segmentation methods to the gold standard. |

Colour changes during the cell cycle indicated by FUCCI markers in two daughter cells labelled a and b (see also Figure 7). Time is in minutes following division. The overlap in the red and green fluorescence (transition between G1 and S phase) is shown for cell b (bottom panel). White outlines are given for nuclei showing weak fluorescence. |
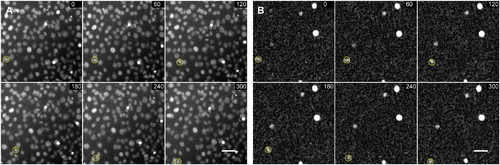
Example of C2C12 cell motion. The highlighted cell has been tracked through multiple frames. Scale bar is 50 microns. Time is displayed in minutes. A) Hoechst channel B) GFP Channel. |

Segmentation score plots. A) Artificial cell images from Simcep [42]. B) Ground Truth image. C) Precision, Recall & F-Score for the SimCep images. D) Comparison of cell detection accuracies for various segmentation methods. |
Segmentation of C2C12 cells at a higher resolution, obtained using a 20× NA 0.75 objective. |

Dividing cell visualised using FUCCI markers. The green FUCCI S-G2-M marker fades after mitosis followed by a slow increase in red G1 marker. Time displayed in minutes same as Figure S11 above. |

Segmentation of zebrafish PAC2 cells using the ‘Multi-Channel Segmentation’ method. |