
|
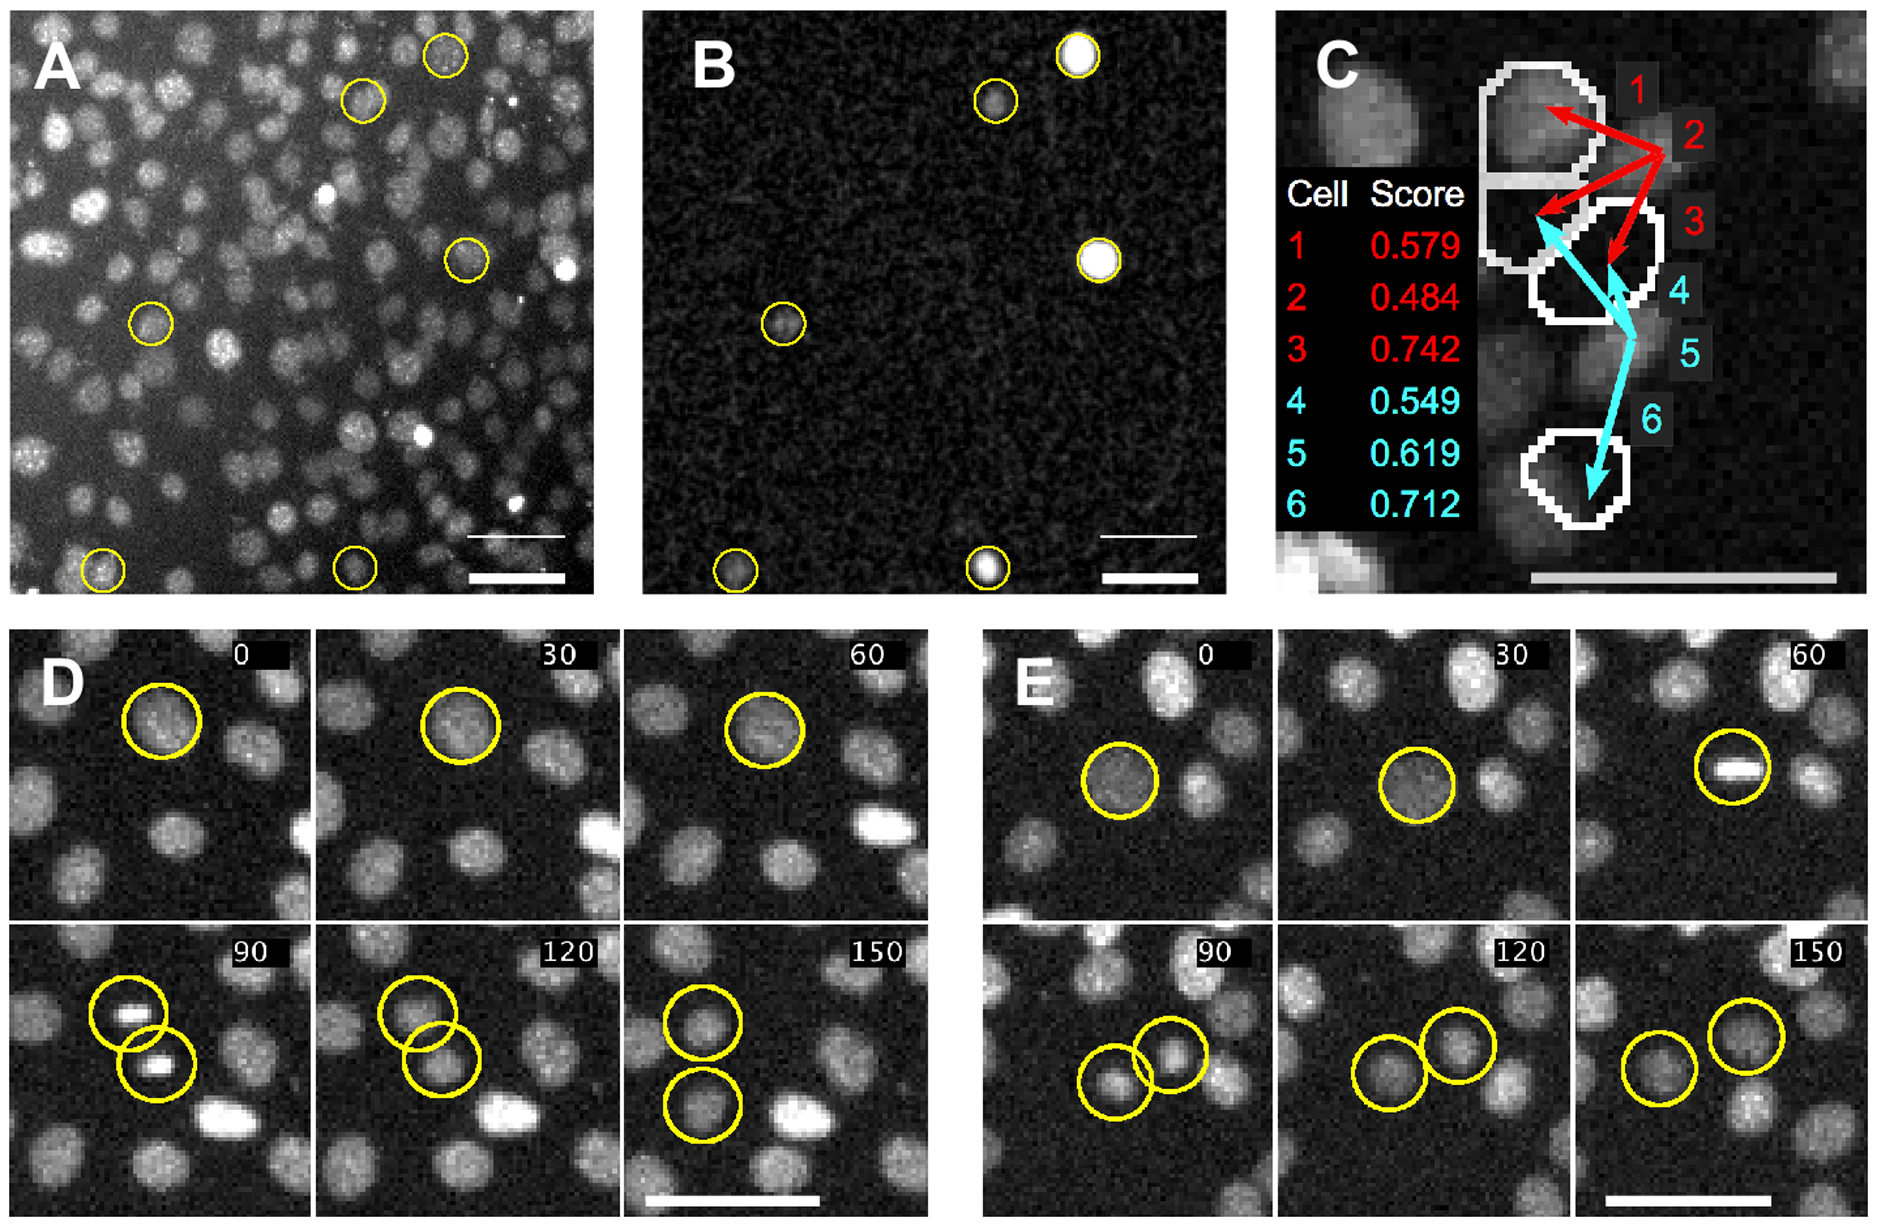
Fig. 1
Magnified section of an image obtained from the Cellomics automated microscope.
A) C2C12 cells labelled with Hoechst stain. B) Same view showing expression of GFP driven by a Msx1 promoter. GFP expressing cells have been highlighted in yellow in A and B. C) Potential ambiguity in linking cells in subsequent frames (white outlines). Arrows represent potential trajectory assignments with numbers representing the calculated score for each potential assignment. D and E) Cell divisions exhibiting chromatin condensation close to the point of division. Time is displayed in minutes. Scale bar in all images is 50 microns. (C and D have been adapted from [24].