
- Title
-
Osteoclasts in bone modeling, as revealed by in vivo imaging, are essential for organogenesis in fish
- Authors
- Chatani, M., Takano, Y., and Kudo, A.
- Source
- Full text @ Dev. Biol.
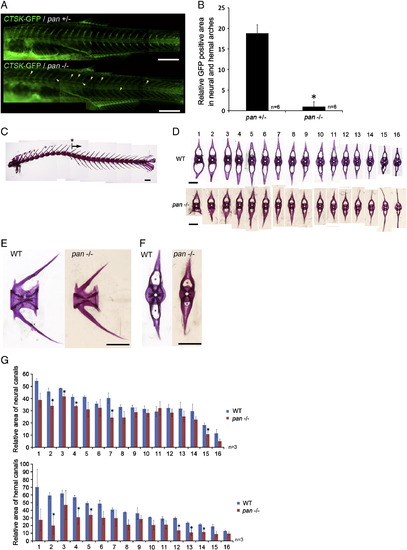
Comparison of osteoclasts in zebrafish during skeletal development of the wild-type and panther mutant zebrafish. (A) Development of OCs in the CTSK-GFP transgenic zebrafish. Lateral views of 8.5 mm larvae at 23 dpf of the zebrafish heterozygous (left; pan+/-) and homozygous (right; pan-/-) for the c-fms mutation. Anterior to the left. Yellow arrowheads show the CTSK-GFP positive cells in the panther mutant. (B) Relative CTSK-GFP positive area. GFP positive areas in the quantitative analysis were measured by image J software (pan+/- n = 6, pan-/- n = 6; error bars indicate s.d.; *p < 0.001 vs. WT). (C–F) Skeletal structures of the wild-type and panther mutant adult zebrafish. Bony tissues of 11 month-old adult zebrafish were stained with Alizarin Red. (C) Lateral view of wild-type zebrafish vertebrae. Ribs were removed. Vertebrae that have 16 or 17 hemal arches were started at the site shown in * toward the caudal fin ray (shown black arrow). (D) Frontal views of individual vertebrae of the wild-type (upper images) and panther (lower images). (E) Lateral views of a vertebrae, anterior to the left. (F) Frontal views of the same vertebrae. Red asterisks show the neural canal; and the blue one, the hemal canal. In the panther mutant, the diameter of the neural (F, red asterisks) or hemal canal (F, blue asterisks) became narrow. (G) Quantitative analysis for the size of areas of neural (upper graph) and hemal (lower graph) canals measured by image J software (WT n = 3, pan-/- n = 3; error bars indicate s.e.m.; *p < 0.05 vs. WT). Scale bars: 500 μm (A, C, D, E, F). PHENOTYPE:
|
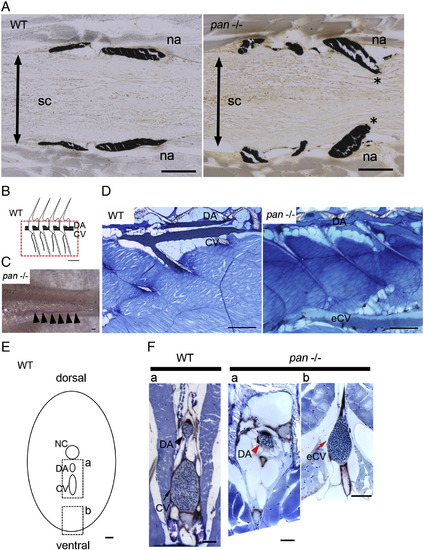
Abnormal development of the neural tube and blood vessels in panther. (A) Horizontal sections through the spinal cord of the adult wild-type (left) and panther mutant (right). Anterior to the left. Mineralization of neural arch was detected by von Kossa staining (black). Deposits of mineral (*) had penetrated into the spinal cordin the panther mutant. (B) The pattern diagram of lateral view of zebrafish blood vessel in the caudal region of the WT adult is shown. The red-dotted rectangle on diagram shows approximate location of region imaged in panel in ′′D′′. DA, dorsal aorta; CV, caudal vein. (C) Ectopic formation of blood vessel (arrowheads) in panther. Shown in bright-field image (n = 10). (D) Sagittal sections through the main blood vessels of the adult wild-type (left; n = 2) and panther mutant (right; n = 2). Anterior to the left. The sections were stained with methylene blue. (E) Pattern diagram of a cross view of zebrafish blood vessel in the caudal region of the WT adult. Dotted line boxes (a, b) on diagram show approximate location of regions imaged in panels of a and b in ′′F′′, respectively. (F) Cross sections through the main blood vessels of the adult wild-type and panther mutant. The sections were stained with methylene blue to detect blood cells, and the enzymatic activity of Alkaline phosphatase was examined to reveal blood vessels. Left figure shows the wild-type and right (pan-/-) figures show an abnormal phenotype in the panther mutant (n = 2). Black arrowhead shows DA and black arrow shows CV (WT, a), indicating many blood cells inside the vessels. Red arrowhead shows DA (pan-/-, a). Red arrow shows eCV (pan-/-, b), revealing the ectopic blood vessels and many blood cells inside the vessels in the panther mutant. DA, dorsal aorta; CV, caudal vein, eCV; ectopic caudal vein; NC, notochord. Scale bars: 100 μm (A), 500 μm (B, C), 300 μm (D) and 50 μm (E, F). PHENOTYPE:
|
Reprinted from Developmental Biology, 360(1), Chatani, M., Takano, Y., and Kudo, A., Osteoclasts in bone modeling, as revealed by in vivo imaging, are essential for organogenesis in fish, 96-109, Copyright (2011) with permission from Elsevier. Full text @ Dev. Biol.