
- Title
-
The Mechanism for Primordial Germ-Cell Migration Is Conserved between Japanese Eel and Zebrafish
- Authors
- Saito, T., Goto-Kazeto, R., Kawakami, Y., Nomura, K., Tanaka, H., Adachi, S., Arai, K., and Yamaha, E.
- Source
- Full text @ PLoS One
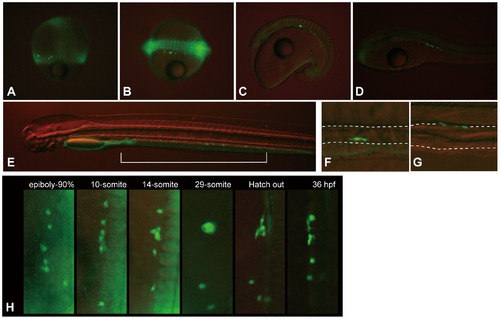
Localization and behavior of visualized eel PGCs during migration. (A) 60%-epiboly stage. (B) 14-somite stage. (C) 29-somite stage. (D) Embryo at 36 hpf. (E) Embryo at 84 hpf. (F) A magnified image of Figure 2E, where PGCs were located. PGCs were localized around the lower side of the developing gut. (G) A magnified image of 6 dpf embryo, where PGCs were localized. GFP-labeled PGCs were seen localized toward the upper side of the alimentary canal. (H) The coalescence of PGCs during their migration (also see Movie S1). These figures show that several PGCs coalesced tightly together during somitogenesis with the appearance of almost a single cell. The PGCs, however, broke apart and proceeded with migration at around the time of hatching. The bracket in E shows the area where PGCs were localized in the embryo. Dashed lines in F and G delineate the outline of a developing alimentary canal. |
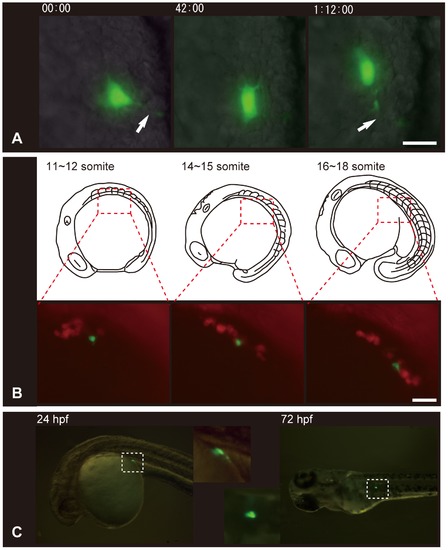
Behavior and migration of a transplanted eel PGC in zebrafish host embryo. (A) An eel PGC extended a long filopoduim-like process and moved actively in zebrafish embryos (also see Movie S2). The time elapsed (in minutes) from the time imaging was begun can be seen at the top of each figure. Arrows indicate the filopodium-like process. (B) A transplanted eel PGC migrated along with endogenous zebrafish PGCs toward the area of future gonad formation. The GFP-labeled cell is a transplanted eel PGC and RFP-labeled cells are endogenous zebrafish PGCs (also see Movie S3). Boxed areas with red dashed lines in the upper illustration indicate the region in the corresponding photograph. (C) A transplanted eel PGC that has migrated to the precise region of future gonad formation in the zebrafish embryo. The two smaller images in the middle show the corresponding boxed areas at a higher magnification. The scale bars in A and B represent 10 μm and 50 μm, respectively. |