
- Title
-
Transgenerational analysis of transcriptional silencing in zebrafish
- Authors
- Akitake, C.M., Macurak, M., Halpern, M.E., and Goll, M.G.
- Source
- Full text @ Dev. Biol.
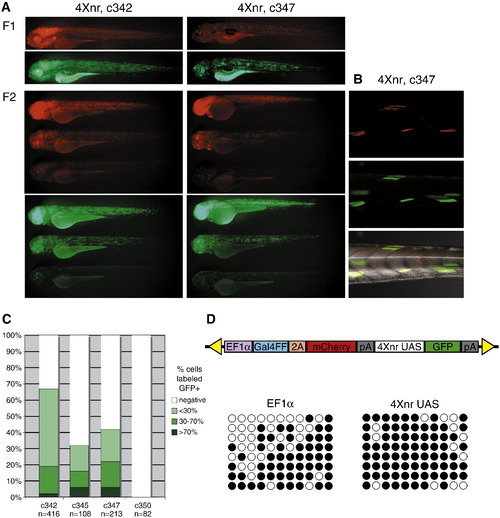
Silencing across Gal4FF bicistronic transgenic insertions. (A) Lateral views of GFP and mCherry labeling in 3 dpf larvae from two transgenic lines in which GFP is regulated by the 4Xnr UAS. GFP expression recapitulates the pattern of mCherry in independently derived F1 larvae, which can be variable in their fluorescence. Representative sibling larvae in the F2 generation show widespread, highly mosaic, or largely absent mCherry and GFP labeling. (B) Colocalization of variegated mCherry and GFP fluorescence in muscle fibers of a c347 F2 larva. (C) Comparison of approximate number of GFP-labeled cells in F2 larvae from lines carrying the 4Xnr UAS (c342, c345, and c347) and the 14X UAS (c350). (D) Schematic of Gal4FF bipartite reporter construct and analysis of CpG methylation in c347 F2 larva from DNA bisulfite sequencing. Methylation at eleven CpGs within the EF1α promoter and the 4Xnr UAS are indicated on the horizontal axis, with black circles indicating methylated CpGs and open circles representing unmethylated CpGs. Patterns from eight different representative clones from one larva are shown on the vertical axis. EXPRESSION / LABELING:
|
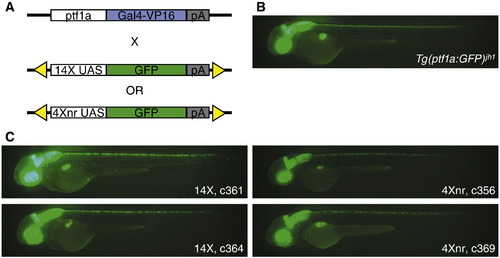
Assay of UAS constructs in binary transgenic system. (A) Experimental scheme using the Tg(ptf1a:Gal4-VP16)jh16 driver line for transcriptional activation of 14X and 4Xnr UAS:GFP reporter transgenes. (B) Pattern of tissue-specific fluorescence in Tg(ptf1a:GFP)jh1/+ larvae at 2 dpf (Pisharath et al., 2007). (C) In the presence of the ptf1a driver, larvae from independently derived lines that carry either 14X UAS:GFP or 4Xnr UAS:GFP transgenes show a similar pattern of GFP labeling. EXPRESSION / LABELING:
|
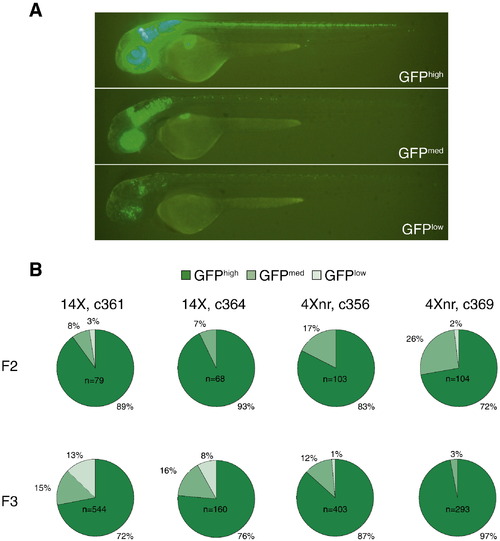
Transgenerational analysis of UAS-regulated GFP expression. (A) Scoring of representative c364 transgenic larvae carrying the ptf1a driver and 14X UAS:GFP reporter transgenes as GFPhigh, GFPmed, or GFPlow, based on the extent of GFP labeling within the ptf1a expression domain. (B) Transgenerational analysis of GFP fluorescence in independently derived lines. All F2 larvae were obtained from matings between single F1 adults and AB fish. After F2 larvae were evaluated for their GFP labeling, GFPmed and GFPhigh individuals were raised, mated to AB, and their progeny scored in the F3 generation. Only GFP-positive F3 larvae were included in the pie charts, which represent the cumulative data from at least five different GFPmed and GFPhigh F2 parents for each line. |
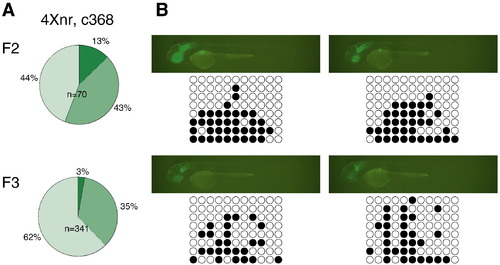
Correlation between variegated expression and CpG methylation. (A) In the c368 line, variegation in GFP labeling was observed in F1 larvae (not shown) and was more frequently observed in F2 and F3 larvae compared to other 4Xnr UAS lines (compare with Fig. 3B). Few c368 GFPhigh larvae were found in either generation. (B) Fluorescence images and representative DNA bisulfite sequencing data for individual GFPmed and GFPlow c368 F2 larvae at 2 dpf. The upper larvae possess both the c368a and c368b transgenic insertions (Table 2), whereas the bottom two larvae have only the c368a transgene. GFP-labeled individuals carrying only the c368b insertion were not detected. EXPRESSION / LABELING:
|
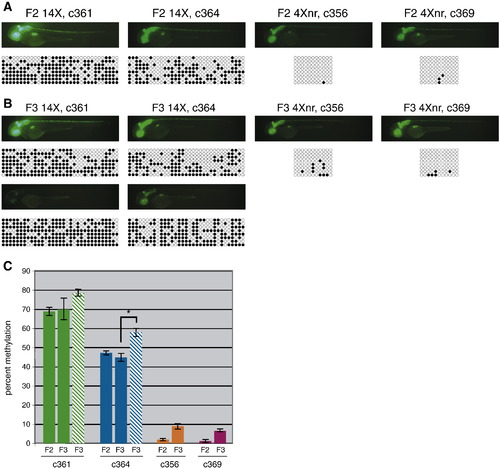
Reduced CpG methylation at the 4Xnr UAS. (A) Fluorescence images and corresponding DNA bisulfite sequencing data for representative 2 dpf F2 larvae. Methylation at the 33 CpGs in the 14X UAS or the 11 CpGs in the 4Xnr UAS promoter are indicated on the horizontal axis, with black circles indicating methylated CpGs and open circles unmethylated CpGs. Patterns from eight different clones are shown on the vertical axis. (B) Fluorescence images and corresponding DNA bisulfite sequencing data for GFPhigh (top) and GFPlow (bottom) F3 larvae from 14X UAS lines and GFPhigh larvae from 4Xnr UAS lines. (C) Quantification of DNA bisulfite methylation data. Solid bars and striped bars indicate the average percentage of methylation of 14X UAS GFPhigh and GFPlow individuals, respectively. Percent methylation corresponds to the number of methylated CpG residues divided by the total number of CpG residues. Error bars represent standard error of the mean, P-values were calculated using the Fisher′s exact test and Mann–Whitney U test, with *p < 0.01. |
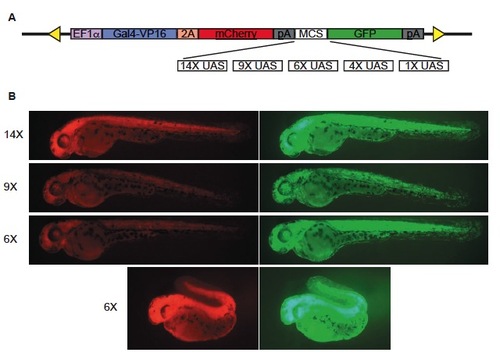
Dual reporter system to monitor Gal4-VP16 expression and UAS-driven transcription simultaneously. (A) Schematic diagram of the bicistronic construct used to generate transgenic lines for testing UAS copy number variants. Under the control of the EF1α promoter, Gal4- VP16 and mCherry are produced in equimolar amounts due to incorporation of the viral 2A peptide sequence. UAS copy number variants and the E1b minimal promoter were inserted into a multiple cloning site (MCS) upstream of GFP. (B) Transgenic F1 larvae generated with different UAS copy number variants show widespread, mCherry (left) and GFP (right) fluorescence at 2 dpf, but develop defects and do not survive to adulthood. |
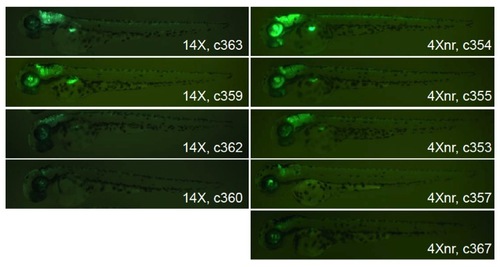
Variability in GFP labeling in offspring from independent transgenic founders. F1 larvae carrying the Tg(ptf1a:Gal4-VP16)jh16 driver line and either 14X or 4Xnr UAS transgenes. Some individuals display robust GFP labeling in the ptf1a expression domain (retina, hindbrain, spinal cord, and pancreas primordium) at 2 dpf, while others exhibit fluorescence in only a subset of cells in the expected pattern. |
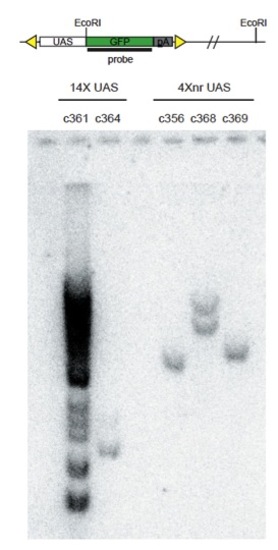
Analysis of transgene insertion number. Genomic DNA derived from fin clips of individual F1 adults was digested with EcoRI. The Southern blot was probed using radiolabeled GFP sequence. Single transgenic insertions were detected for lines c364, c356, and c369. Two insertions were detected in c368, whereas c361 contained greater than 10. |
Reprinted from Developmental Biology, 352(2), Akitake, C.M., Macurak, M., Halpern, M.E., and Goll, M.G., Transgenerational analysis of transcriptional silencing in zebrafish, 191-201, Copyright (2011) with permission from Elsevier. Full text @ Dev. Biol.