
|
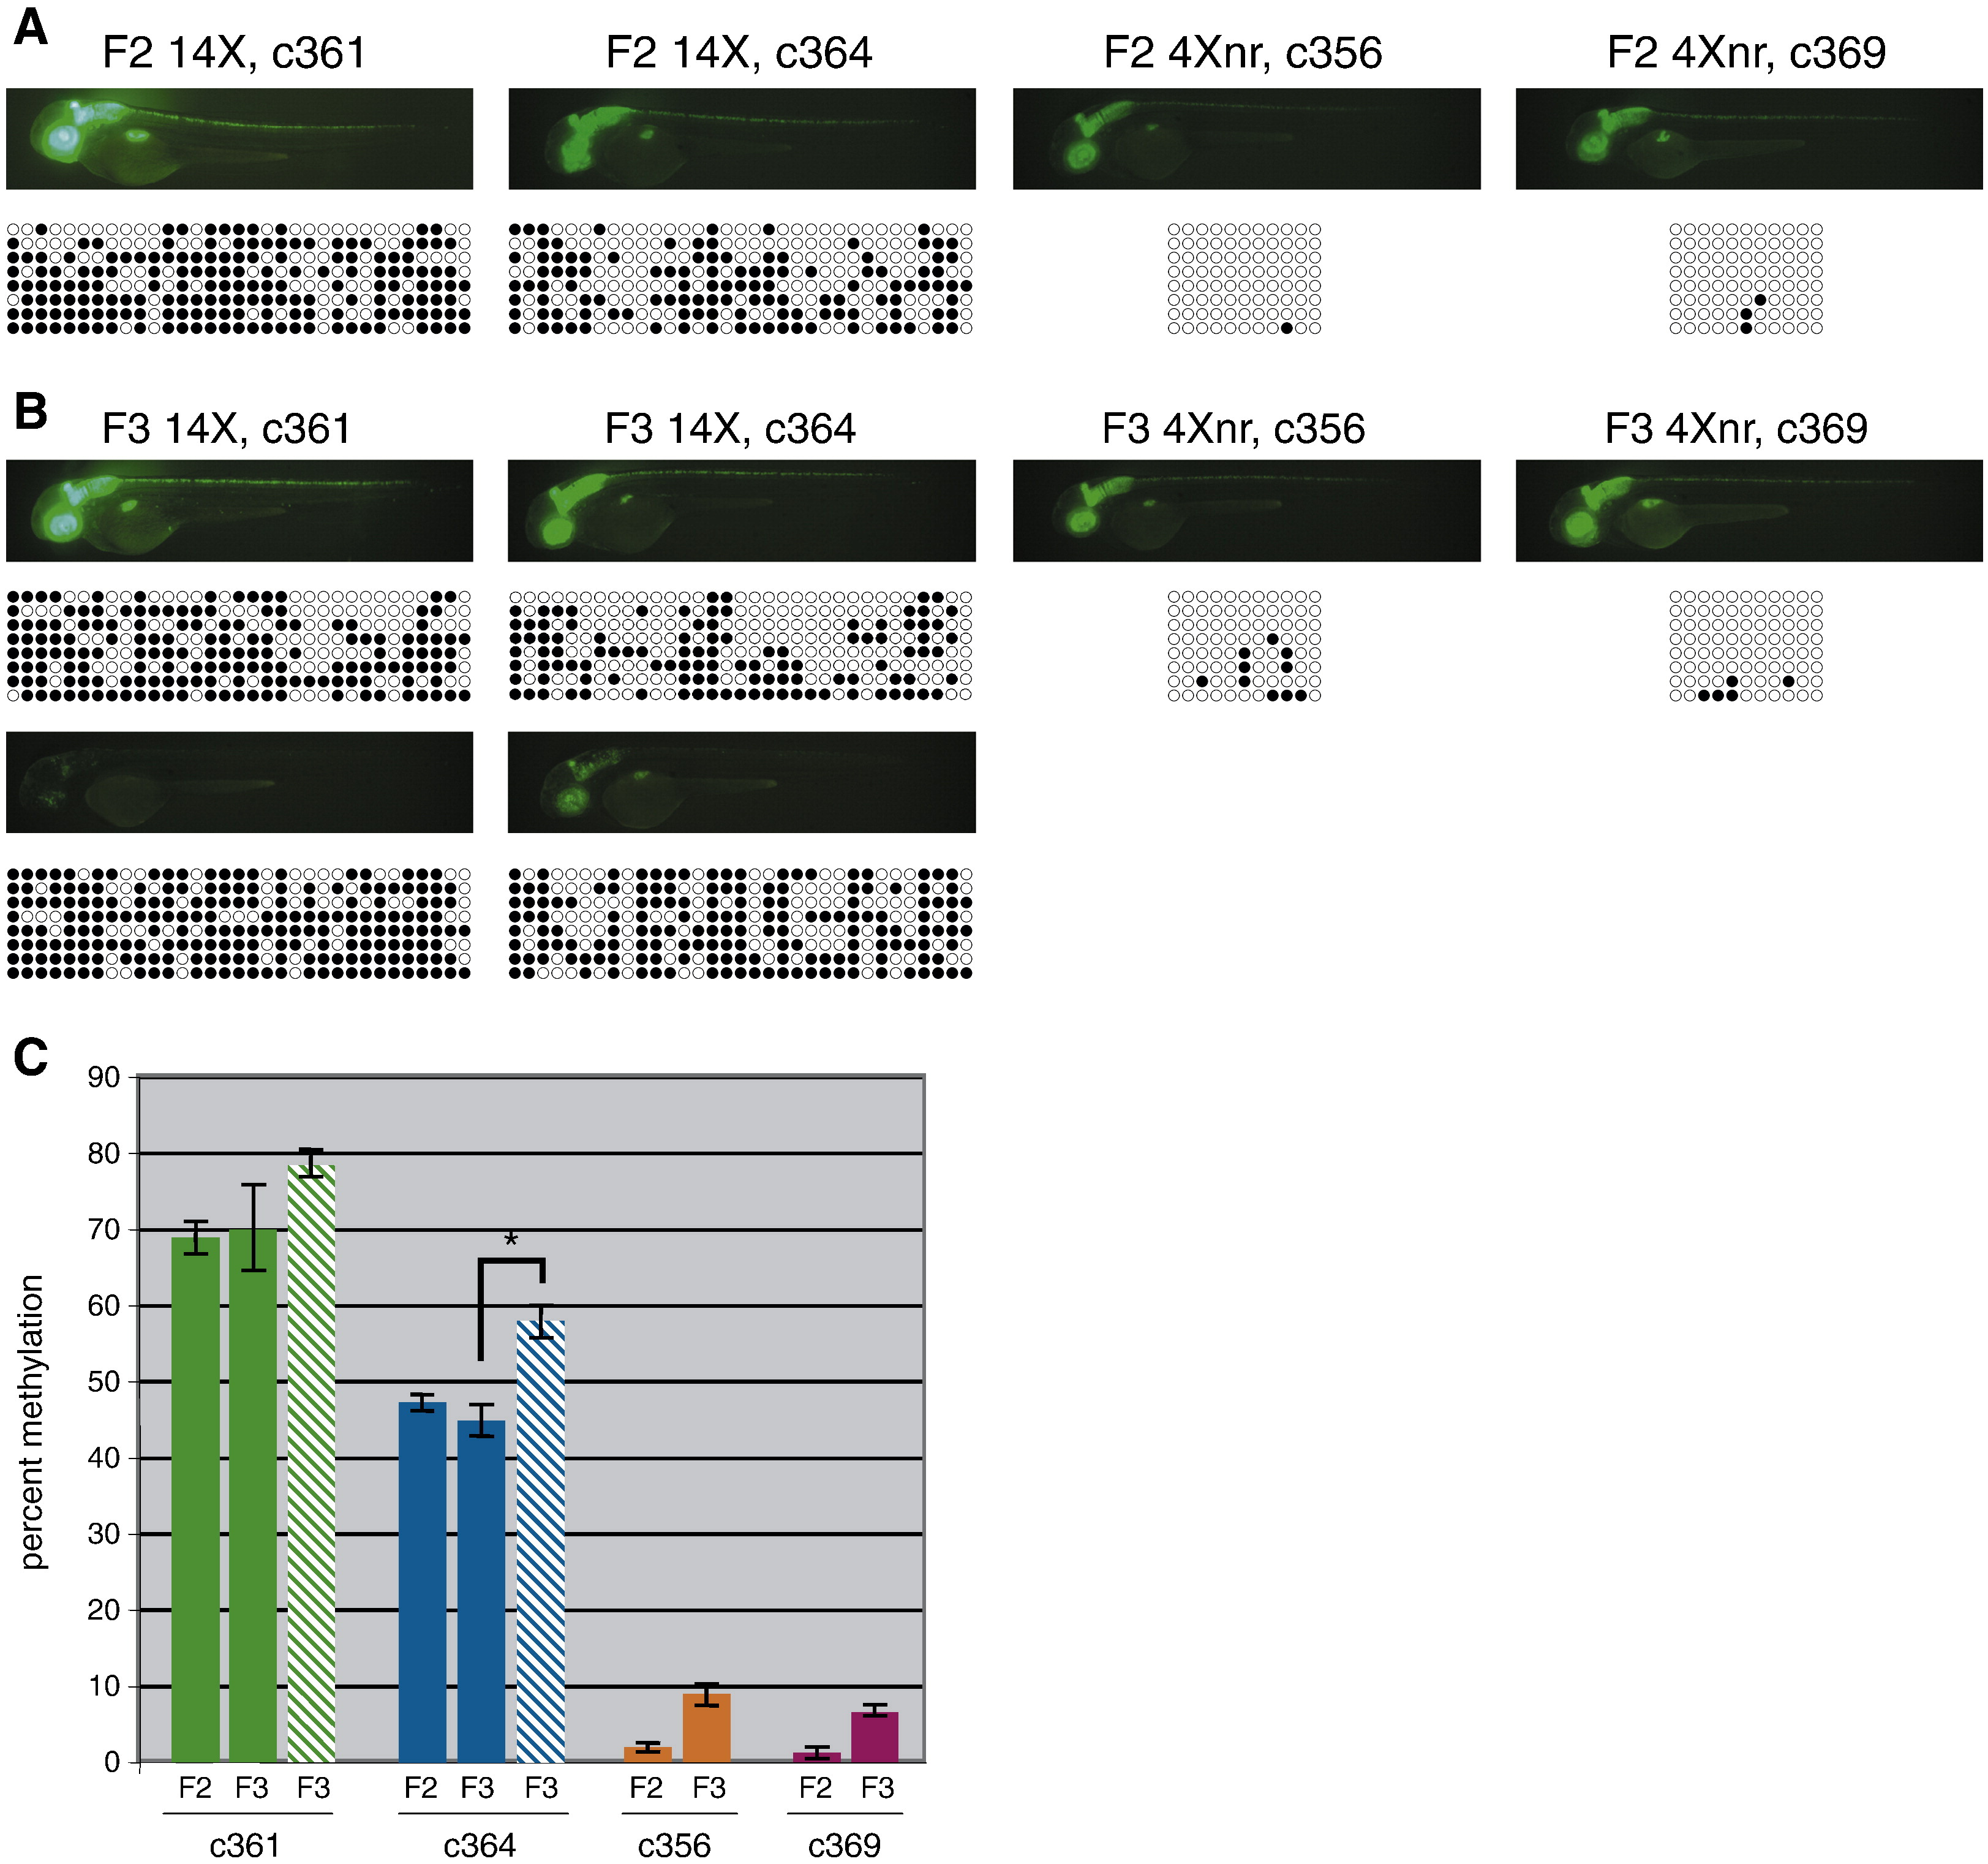
Fig. 5 Reduced CpG methylation at the 4Xnr UAS. (A) Fluorescence images and corresponding DNA bisulfite sequencing data for representative 2 dpf F2 larvae. Methylation at the 33 CpGs in the 14X UAS or the 11 CpGs in the 4Xnr UAS promoter are indicated on the horizontal axis, with black circles indicating methylated CpGs and open circles unmethylated CpGs. Patterns from eight different clones are shown on the vertical axis. (B) Fluorescence images and corresponding DNA bisulfite sequencing data for GFPhigh (top) and GFPlow (bottom) F3 larvae from 14X UAS lines and GFPhigh larvae from 4Xnr UAS lines. (C) Quantification of DNA bisulfite methylation data. Solid bars and striped bars indicate the average percentage of methylation of 14X UAS GFPhigh and GFPlow individuals, respectively. Percent methylation corresponds to the number of methylated CpG residues divided by the total number of CpG residues. Error bars represent standard error of the mean, P-values were calculated using the Fisher′s exact test and Mann–Whitney U test, with *p < 0.01.
Reprinted from Developmental Biology, 352(2), Akitake, C.M., Macurak, M., Halpern, M.E., and Goll, M.G., Transgenerational analysis of transcriptional silencing in zebrafish, 191-201, Copyright (2011) with permission from Elsevier. Full text @ Dev. Biol.