
- Title
-
Hedgehog signalling is required for perichondral osteoblast differentiation in zebrafish
- Authors
- Felber, K., Croucher, P., and Roehl, H.H.
- Source
- Full text @ Mech. Dev.

The Hedgehog receptors ptc1 and ptc2 are expressed in the perichondrium of the central region of the ceratohyal. (A–C and G–I) are ventral views of developmental stages 72–120 hpf. (D–F and J–L) are high magnification views of the ceratohyal cartilage at the same time points. ptc1 expression is highly enriched in the perichondrium during this period. ptc2 is more broadly expressed but is also expressed in the perchondrium. Arrowheads point to expression of ptc1 and ptc2 in the perichondrium. Scale bar for high-magnification pictures = 50 μm. |

von Kossa staining of 6 dpf old zebrafish embryos shows the specific loss of chondral ossification after inhibition of the Hedgehog pathway. (A and B) Side and ventral views of the head indicating the positions of the bones analyzed in this study. (C, E, G and I) are control fish which were treated with EtOH. (D, F, H and J) are embryos treated with cyclopamine. The cyclopamine treatments from 72 to 96 hpf (E and F) and 96 to 120 hpf (G and H) show loss of chondral ossification of the ceratohyal and hyomandibula. Achondral ossification (the dentary and other bones) is unaffected. Embryos treated from 48 to 72 hpf (C and D) and 120 to 144 hpf (I and J) do not show a strong change in ossification. (K) shown the quantification of ossification of the ceratohyal and hyomandibula from the experiments shown in (C–J). (L) shown the quantification of ossification of the dentary from the experiments shown in (C–J). Notes on figures: Abbreviations: mx = maxilla; de = dentary; ch = ceratohyal and hm = hyomandibula; op = opercle; bs = branchiostegal ray. The timings of experiments shown in [Fig. 2, [Fig. 3], [Fig. 4], [Fig. 5], [Fig. 6] and [Fig. 7] are labeled with the following nomenclature: start of treatment (duration of treatment) time of fixation. Scale bars for high-magnification pictures = 50 μm. In [Fig. 2], [Fig. 3], [Fig. 4], [Fig. 5] and [Fig. 6], each panel shows low magnification side and ventral views to the left and high magnification ventral views to the right. Anterior is to the left. |
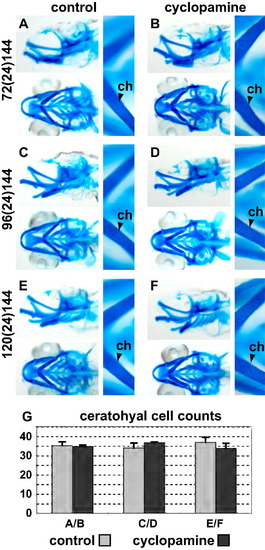
Alcian blue staining of 6 dpf old zebrafish embryos shows that chondrocyte differentiation and proliferation are unaffected by the loss of Hedgehog signalling after 72 hpf. (A, C and E) show the EtOH treated control fish. (B, D and F) show embryos treated with cyclopamine. There in no change in patterning or differentiation of the cartilage skeleton at the time points investigated as judged by morphology. (G) shown the quantification of the number of chondrocytes in the ceratohyal from the experiments shown in (A–F). Please see Fig. 2 for abbreviations and notes. |
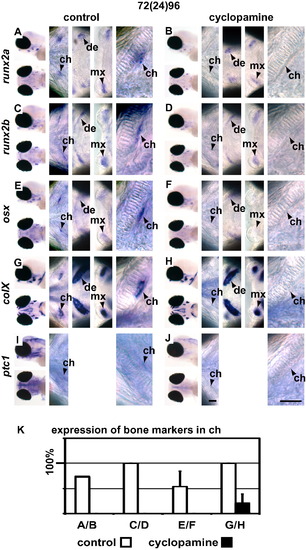
Cyclopamine treatment downregulates expression of osteoblast markers predominantly in chondral ossification centres. (A, C, E, G and I) are control (EtOH treated) embryos and (B, D, F, H and J) are embryos treated with cyclopamine from 72 to 96 hpf. Expression of runx2a (A and B), runx2b (C and D), osx (E and F) and colX (G and H) was reduced or absent in the ceratohyal of cyclopamine treated fish. Expression in achondral ossification centres such as those of the dentary and maxilla was only mildly reduced or not affected at all. (I and J) shows ptc1 expression that shows that Hedgehog signalling is abolished in the perichodrium after cyclopamine treatment. (K) shown quantification of the staining shown in A–H. Please see Fig. 2 for abbreviations and notes. |
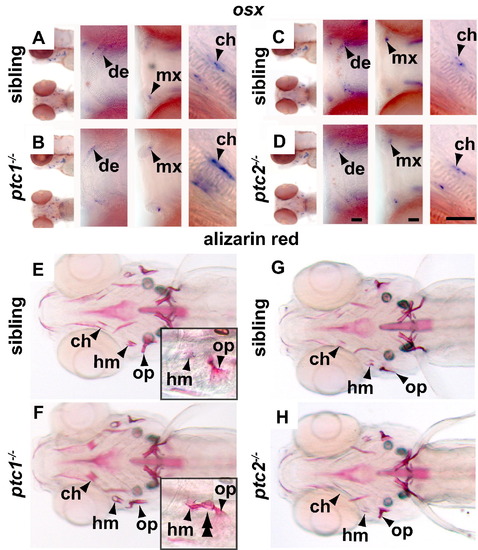
ptc1-/- fish have enhanced osteoblastogenesis. osx staining at 96 hpf of wild type (A and C), ptc1-/- (B) and ptc2-/- fish (D) reveals that ptc1-/- larvae have increased expression in the ceratohyal perichondrium and ptc2-/- fish have no change. Expression at achondral sites of ossification is unaffected. Alizarin red staining at 168 hpf of wild type (E and G), ptc1-/- (F) and ptc2-/- fish (H) shows that some of the ptc1-/- fish have increased perichondral ossification (7 out of 25 mutant fish) while ptc2-/- fish are indistinguishable from their siblings. ptc1-/- fish also have ectopic perichondral ossification (5/25) that bridges from the joint of the opercle to the hyomandibula (insets in E and F). Please see Fig. 2 for abbreviations and notes. |

runx2b expression responds to cyclopamine treatment at a similar rate as that of ptc1. Fish were treated with cyclopamine or EtOH starting at 72 hpf and then fixed at 76 hpf (A, B, G and H), 78 hpf (C, D, I and J) or 80 hpf (E, F, K and L). Cyclopamine treatment only leads to a strong reduction of runx2b and ptc1 expression after 8 h (F and L). (M) shown the quantification of the number ceratohyal primordia expressing runx2b from (A–F). Please see Fig. 2 for abbreviations and notes. |
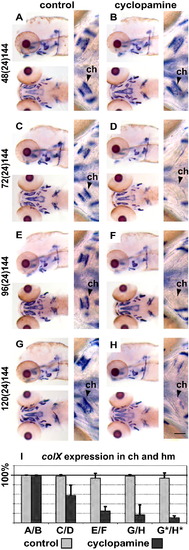
Hedgehog signalling is required from 72 hpf onwards for osteoblast differentiation in chondral ossification centres. (A, C, E and G) are control embryos treated with EtOH and (B, D, F and H) are cyclopamine treated embryos. Embryos treated from 48 to 72 hpf do not show any changes in colX expression at 144 hpf (A and B). However, those treated with cyclopamine from 72 to 96 hpf (C and D), 96 to 120 hpf (E and F) and 120 to 144 hpf (G and H) show reduced colX expression in chondral ossification centres. (I) shows the quantification of the number ceratohyal and hyomandibular primordia expressing colX at 144 hpf from (A–H) and at 96 hpf (Fig. 4G and H, marked by an asterisk). Please see Fig. 2 for abbreviations and notes. |
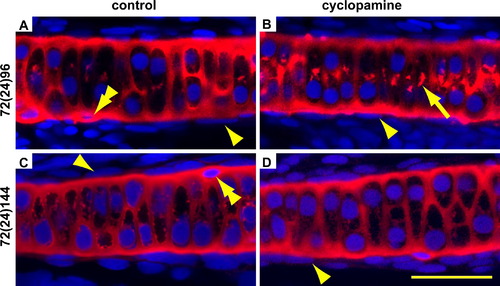
Blocking Hedgehog signalling does not lead to ectopic differentiation of chondrocytes in the perichondrium of the ceratohyal. Embryos were treated from 72 to 96 hpf then fixed immediately (A and B) or allowed to recover until 144 hpf (C and D). The cartilage is visualised with an antibody for Col II in red, and counterstained for nuclei with DAPI in blue. The arrowheads point to the flattened nuclei of the perichondrium which is present after EtOH (A and C) as well as cyclopamine treatment (B and D). There is no ectopic cartilage formation after cyclopamine treatment (B and D). However, Collagen 2 secretion is temporarily disrupted as shown by increased intracellular staining (arrow in B). There are unidentified cells on the edge of the cartilage that are embedded in Col II, but have not intercalated with the other chondrocytes and have highly condensed nuclei (double arrowheads in A and C). There are several of these cells on each ceratohyal and their presence was not affected by treatment. Please see Fig. 2 for abbreviations and notes. |
Reprinted from Mechanisms of Development, 128(1-2), Felber, K., Croucher, P., and Roehl, H.H., Hedgehog signalling is required for perichondral osteoblast differentiation in zebrafish, 141-152, Copyright (2011) with permission from Elsevier. Full text @ Mech. Dev.