
- Title
-
Emergence of traveling waves in the zebrafish segmentation clock
- Authors
- Ishimatsu, K., Takamatsu, A., and Takeda, H.
- Source
- Full text @ Development
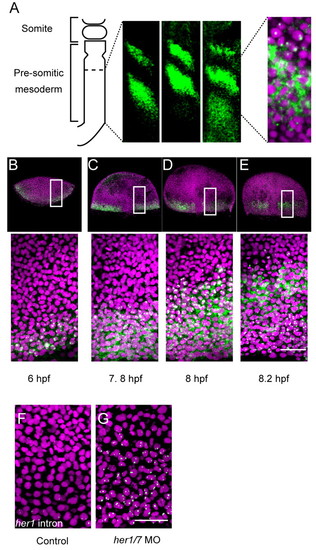
Overview of the segmentation clock in the zebrafish embryo. Anterior to top, posterior to bottom. Green, her1 mRNA in situ hybridization; magenta, nuclear counterstain. (A) Subcellular localization of her1 mRNA in the traveling wave during the segmentation stage. (B-E) Emergence of the traveling wave at the blastula stage. The boxed regions are enlarged in the panels beneath. (F,G) Control and her1/7 morpholino-injected samples. The injected morpholino was designed against the first ATG and her1 transcripts were detected with the intron probe; thus, the signals detected cannot result from mRNA stabilized by morpholino binding. Scale bar: 50 μm. |
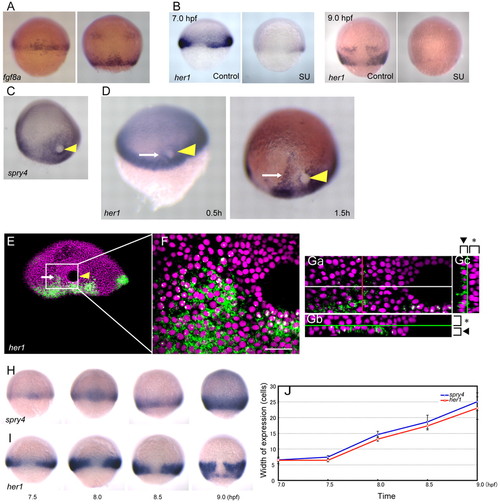
her1 oscillation is induced by Fgf. (A) Expression of fgf8a at the mid (left) and late (right) epiboly stage. (B) her1 expression disappears following treatment with the Fgf inhibitor SU5402. Left and right panels show her1 expression at the stage before (7.0 hpf) and after (9.0 hpf) the emergence of the traveling wave, respectively. (C-G) Ectopic Fgf induces an ectopic her1 traveling wave. (C) Ectopic expression of spry4 was induced by Fgf8b-soaked bead implantation (arrowhead). (D) Ectopic her1 expression (arrow) is first detected in close vicinity to the Fgf bead (left, 0.5 hours after transplantation) and tends to gradually expand with time, forming a band-like expression domain (right, 1.5 hours after transplantation). (E,F) Subcellular localization of induced her1 expression. (Ga-c) Induction of the traveling wave by Fgf bead transplantation occurs only in the hypoblast. Optical sections of the sample shown in E,F along the z-axis (Ga), x-axis (Gb) and y-axis (Gc). x- and y-axes are shown by white and red lines, respectively, in Ga. Hypoblast and epiblast are indicated by arrowheads and asterisks, respectively. (H,I) The regions of Fgf activity, as indicated by spry4 (H), and her1 expression (I) are almost identical. (J) Time-course analysis of the width (in cells) of spry4 and her1 expression. The number of cells showing nuclear signals was manually counted in samples subjected to high-resolution in situ hybridization (images not shown). Error bars indicate s.d. Scale bar: 50 μm. |
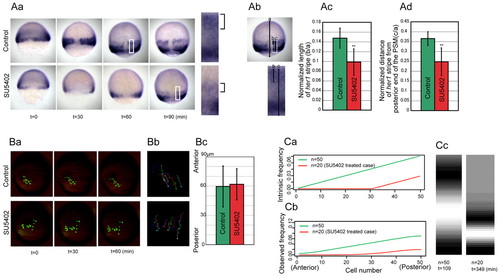
Effect of Fgf inhibition on the her1 oscillation period. (Aa-d) Effect of compromised Fgf signaling on the spatial oscillation pattern of her1. (a) Time series of her1 expression in control (upper) and SU5402-treated (lower) zebrafish embryos. We set the 50% epiboly stage as t=0. The boxed regions, in those images taken at the time points that the her1 stripe first appears, are enlarged to the right. Brackets indicate the first her1 stripes. (b) The length of the her1 stripe (line b) and the distance between the her1 stripe and the posterior end of the PSM (line c) were measured and normalized by embryonic size (line a). (c,d) The normalized length of the her1 stripe and the normalized distance of the her1 stripe from the posterior end of the PSM in SU5402-treated embryos were significantly shorter than in the control; **, P<0.01 (n=12 for control embryos and n=11 for SU5402 treatment). Error bars indicate s.d. (Ba-c) The effect of SU5402 treatment on gastrulation cell movement was limited. (a) Time-course images of the labeled cells with or without SU5402 treatment. The cellular movement was then tracked every 10 minutes (b) and quantified (c). The mean net displacement towards the posterior direction (n=25 cells from three embryos for control and n=34 cells from three embryos for SU5402 treatment) reveals no significant difference in gastrulation movement following the treatment (c). Error bars indicate s.d. (Ca-c) Simulation of a decreased frequency gradient. (a,b) The intrinsic (a) and observed (b) frequency. n indicates the number of cells that were given the gradient of intrinsic frequency. The intrinsic frequency for the SU5402-treated case was fixed at 0 in the cells i=1-30 (a, red) (see Fig. S3 in the supplementary material). (c) The simulated stripe pattern of her1 expression when the stripe first appeared in each condition. n and t beneath the panels indicate the number of cells that were given the gradient of intrinsic frequency and the elapsed time, respectively. Coupling between non-oscillatory cells (n=0-30 in the SU5402-treated case) and oscillatory cells was maintained in this simulation, but we confirmed that the same trend was obtained in the absence of coupling. |
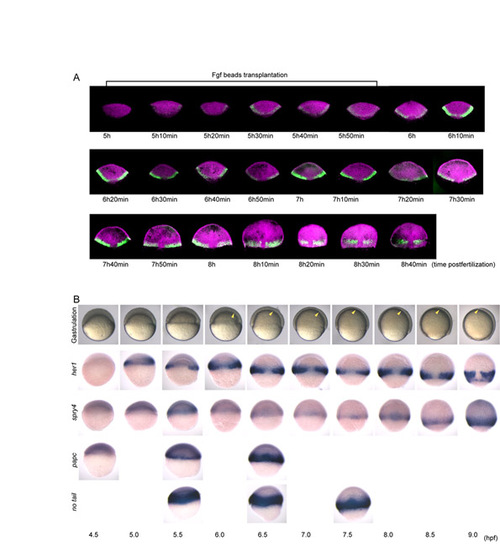
Time-course analysis of expression patterns of her1, spry4, papc, no-tail and the process of gastrulation. (A) To minimize individual differences at developmental stages, we collected embryos by the following method. Embryos that spawn within 10 minutes were collected. Embryos that failed to reach or remain at the 4-, 8- and 16-cell stages within 5 minutes at the fixed time were removed so that the developmental time difference was less than 5 minutes. Ten embryos were then fixed every 10 minutes from 5 hours post-fertilization (hpf) to 8.7 hpf. All procedures were performed in a temperature-controlled room at a fixed 28.5°C. Until 7 hours 50 minutes post-fertilization, her1 oscillation occurs only in the margin area, as reported previously (Riedel-Kruse et al., 2007); the intensity of fluorescence of the her1 mRNA signal repeatedly became stronger and weaker in unison. Then, a traveling wave in a posterior to anterior direction was observed. Under our experimental conditions, traveling waves in a ventral to dorsal direction, as previously reported (Riedel-Kruse et al., 2007), were not observed. (B) The stages of the embryos were strictly controlled as described in A. Gastrulation starts prior to the emergence of the traveling wave and to the anterior expansion of Fgf signaling, indicating that the gastrulation movement is not the primary cause of both events; gastrulation starts at <6.0 hpf and the emergence of the traveling wave and the anterior expansion of Fgf signaling begins at <8.0 hpf. The anterior limit of gastrulating mesoderm is indicated by yellow arrowheads in live embryos (top). The emergence of the traveling wave of her1 and the anterior expansion of Fgf signaling occur at the same stage (8.0 hpf). In addition, both her1 and spry4 are first detected at the same stages (5.0 hpf), suggesting that the early oscillation of her1 also depends on Fgf signaling. papc expression (a marker for the PSM) gradually becomes broader as gastrulation proceeds, while her1 expression remains restricted to the marginal area, supporting the idea that involuting mesoderm cells transiently express her1 before they leave the marginal area and then become negative. no-tail expression (a pan-mesodermal marker) is not identical to that of her1 (the no-tail expression domain is wider than that of her1), indicating that Fgf signaling differentially regulates mesoderm maintenance and clock oscillation. |
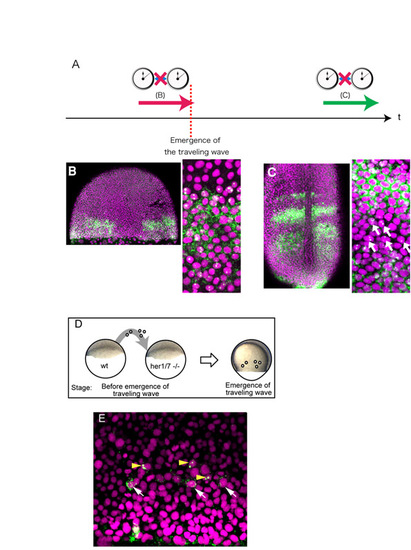
The emergence of the traveling wave does not depend on intercellular communication. (A-C) Inhibition of Notch signaling by DAPT does not affect the emergence of the traveling wave. (A) To examine whether the onset of the her1 traveling wave depends on Notch-dependent intercellular signaling, embryos were treated with the Notch signaling inhibitor DAPT as described previously (Horikawa et al., 2006). (B) An embryo treated with DAPT until the emergence of the traveling wave. The traveling wave was created in the absence of Notch signaling. (C) An embryo treated with DAPT after the emergence of the traveling wave. The spatial pattern of the traveling wave is disturbed, with several transcribing cells detected in the transcription-negative area (arrow). This treatment was performed as a positive control to confirm that DAPT treatment was effective. The two experiments were performed under the same conditions, with the exception of the timing of treatment. Although the horizontal oscillation phase is not exactly the same in the traveling wave at the earlier stage, the occurrence of the traveling wave in the absence of Notch signaling indicates that this wave is not the one relayed from marginal oscillation through Notch signaling. (D,E) We performed transplantation experiments to examine whether unknown intercellular coupling plays a significant role in relaying the marginal her1 oscillation to create the traveling wave. Wild-type cells were transplanted into the her1/7 deletion mutant, which lacks the her1/7 genomic region and thus does not produce any type of her1 oscillation, including the marginal one. If the traveling wave does not depend on intercellular signaling triggered by the margin, the transplanted normal cells can initiate her1 oscillation in the mutant background. (D) Schematic of the cell transplantation assay at the blastula stage. Transplantation was performed at the stage before the onset of her1 marginal oscillation. (E) The transplanted cells show her1 expression with proper phase delay. Since her1/7 mutant cells never express her1, the cells with her1 mRNA signal should be donor cells. The arrowheads indicate cells with her1 transcription, whereas the arrows indicate cells with her1 translation, indicating that the transplanted wild-type cells initiate her1 oscillation with proper phase delay. This result excludes the idea that the traveling wave is triggered by the marginal oscillation through intercellular coupling. Scale bar: 50 μm. |
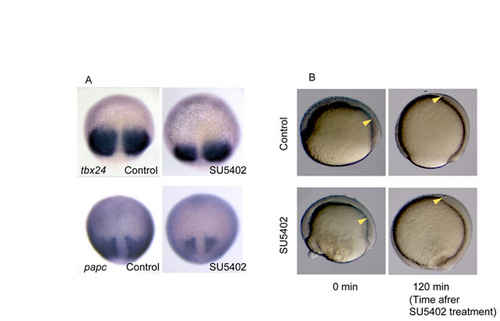
Effect of SU5402 treatment on gastrulation movement and the expression of PSM markers. (A) We examined whether the differentiation and maintenance of the PSM are affected by SU5402 treatment. The presumptive PSM was monitored by the expression of tbx24 and papc. tbx24 is expressed in the anterior two-thirds of the (presumptive) PSM and papc is known to be a paraxial mesoderm marker. Their expression domains were found to posteriorly regress in the SU5402-treated embryos, indicating that SU5402 treatment affects the size of the presumptive PSM. This is not the result of compromised cellular movement because the cellular movement was not affected by SU5402 treatment (see Fig. 3B and Fig. S5B), but possibly by differentiation defects. As described in the main text, we think that the change in her1 spatial pattern in SU5402-treated embryos is not merely a result of decreased size of the presumptive PSM. (B) The anterior limit of the gastrulating mesoderm (yellow arrowheads) reaches the head region normally in the SU5402-treated embryo. This indicates that the gastrulation movement is not substantially affected by SU5402 treatment. |
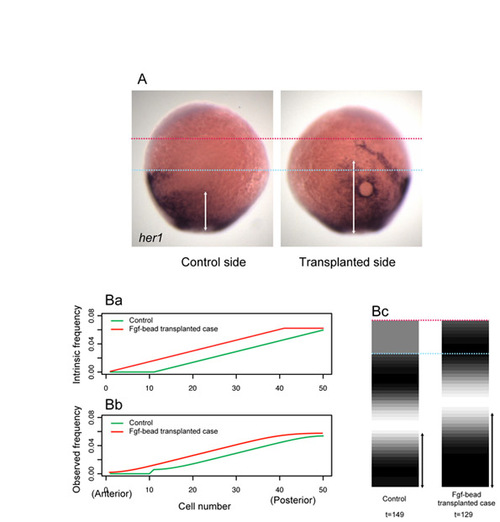
Effect of Fgf-soaked bead transplantation on the her1 expression pattern. (A) Comparison of her1 expression pattern between control and Fgf bead transplanted sides. Each side of the same sample is shown. The anterior her1 stripe was anteriorly shifted and the posterior her1 expression domain became broadened (n=7/9). The light-blue and magenta dots represent the axial levels of the anterior stripe on control and bead transplanted sides, respectively. White arrows indicate the width of the posterior expression of her1 on each side. The transplantation was performed under the same conditions as in Fig. 2C-G except for the stage of transplantation (∼7.0 hpf). (Ba-c) Simulation of an increased frequency gradient. (a,b) The intrinsic (a) and observed (b) frequency. The intrinsic frequency for the Fgf bead transplantation case was fixed at 0.6 in the cells i=40-50 (red). (c) The simulated stripe pattern of the control (left) and bead transplanted (right) cases, when the stripe first appeared under each condition. The simulated spatial pattern recapitulates well the outcome of Fgf bead transplantation. The anterior stripe was anteriorly shifted and the posterior stripe became broader. The light-blue and magenta dots represent the position of the anterior stripe in the control and bead transplanted cases, respectively. White arrows indicate the width of the posterior stripes. The simulation is based on the same equation as in Fig. 3C. For the control simulation, the anterior non-oscillatory cells were not coupled with the posterior oscillatory cells. t under the panels indicates the elapsed time. |