
- Title
-
A live zebrafish-based screening system for human nuclear receptor ligand and cofactor discovery
- Authors
- Tiefenbach, J., Moll, P.R., Nelson, M.R., Hu, C., Baev, L., Kislinger, T., and Krause, H.M.
- Source
- Full text @ PLoS One
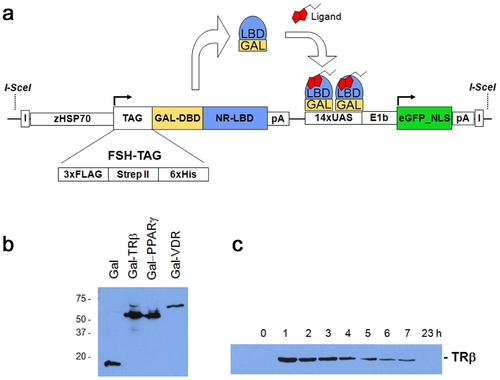
The Ligand Trap (LT) system. (a) Schematic diagram of the multi-component ligand trap (LT) construct. Upon heat pulse, the zebrafish hsp70 promoter directs ubiquitous expression of the GAL4 DNA-binding domain (DBD) fused in-frame to a human nuclear receptor ligand-binding domain (LBD) and an affinity tag cassette (FSH-tag). Upon binding of this fusion protein to the GAL4 UAS (upstream activating sequence) response elements, in the presence of active hormone and cofactors, expression of the reporter gene (nuclear enhanced Green Fluorescent Protein (eGFP)) occurs. Expression of nuclear GFP is used to monitor receptor ligand sensor activity in a cell- and tissue autonomous manner in live zebrafish. The second component makes use of the tags to co-purify bound hormones or cofactors. I = insulator elements; pA = polyadenylation signal; NLS = nuclear localization signal. (b) Western blots of GAL4-NR fusion proteins. Embryos (F2; 72 hpf) were heat pulsed for 30 min at 37°C and recovered for 1 h at room temperature. 10 embryos were pooled and lysed in 50 μl of FSH buffer (see material and methods) followed by adding SDS buffer and boiling. Proteins were detected using the FLAG-M2 antibody. (c) Time course of fusion protein expression. TRβ embryos (F2; 72 hpf) were heat induced as in 1b) and recovered for the times indicated. Each sample contained 10 embryos. |
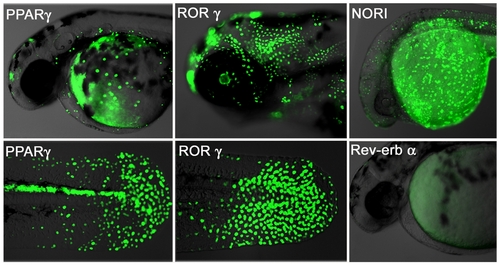
Human NRs interact with fish ligands and cofactors. Transgenic NR zebrafish show unique GFP patterns at different stages of development. Activity patterns of the PPARγ (first panel), RORγ (middle panel), NOR1 (upper right picture) and Rev-erbα (lower right picture) LT constructs. Embryos were heat pulsed at 37°C for 30 min and images taken 24 h later. PPARγ (48 hpf, F2) embryos show GFP expression in cells of the epidermis and heart, as well as in the posterior spinal cord. Strong GFP expression occurs in the epidermis and retina of RORγ embryos (72 hpf, F2). NOR1 embryos (F3) express GFP in the posterior spinal cord, hatching gland, epidermis and yolk syncictial layer (24 hpf, F2). Rev-erbα embryos show no GFP expression. Overlay pictures of bright field and GFP (75% transparent) are shown. Views are lateral with anterior to the left. |
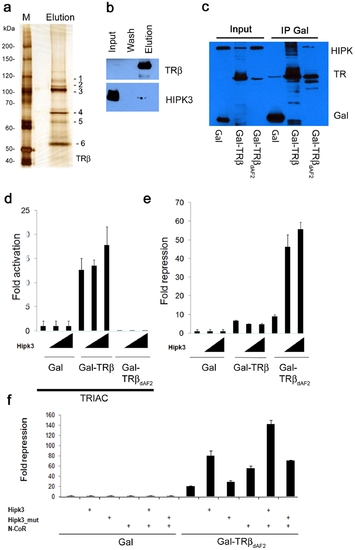
Co-purification of TRβ cofactors. (a) Affinity purification of TRβ from zebrafish embryos. Blastula-/Gastrula-stage embryos were heat induced for 20 min and recovered for 2 h at room temperature. After purification, the eluate was run on an 8% SDS PAGE and then silver stained. Protein bands (indicated as 1–6) were cut and in gel digested followed by mass spectrometry. Identified protein IDs are shown. M = protein marker. (b) Immunodetection of HIPK3. Western blotting using a HIPK3 antibody (lower panel) shows that a subfraction of the protein co-purifies with the bait protein. Presence of the TRβ protein in the same fractions, detected using Flag-M2 antibody, is shown above. (c) HEK293 cells were transfected with FLAG-HIPK3 and one of three different Gal expression constructs containing the FSH-tag: Gal, Gal-TRβ (aa 189–461) and TRβΔAF2 (aa 189–451). After 48 h of transfection, the cells were harvested in IP buffer and Gal and Gal fusion proteins immunoprecipitated using Streptactin Sepharose. Western blotting using a FLAG M2 antibody shows HIPK3 in the Gal-TRβ and Gal-TRβΔAF2 pull downs. (d) Transcriptional activity of TRβ proteins. 293 cells were transfected with a 2xUAS-Luciferase reporter construct (0.2 μg/well) and Gal or Gal-TRβ constructs (0.05 μg/well): Gal-TRβ (aa 189–461) and TRβΔAF2 (aa 189–451) in the presence of 100 nM TRIAC. Fold activation was measured in the presence (0.05 or 0.1 μg/well) or absence of HIPK3. Luciferase values were normalized against β-Gal. (e) Effects of HIPK3 on Gal-TRβ induced repression. 293 cells were transfected with a 2xUAS-Luciferase reporter construct and either Gal, Gal-TRβ or GAL-TRβΔAF2. Fold repression was measured in the presence or absence of HIPK3. Luciferase values were normalized against β-Gal. Transfections as under 3d. (f) The effect of HIPK3 was investigated in the absence or presence of the co-repressor N-CoR. Transfections were performed as in 3d using the Gal-TRβΔAF2 (aa 189–451) construct. Fold repression of the TRβ mutant in the presence of HIPK3 and/or N-CoR (0.05 μg/well) are shown. |
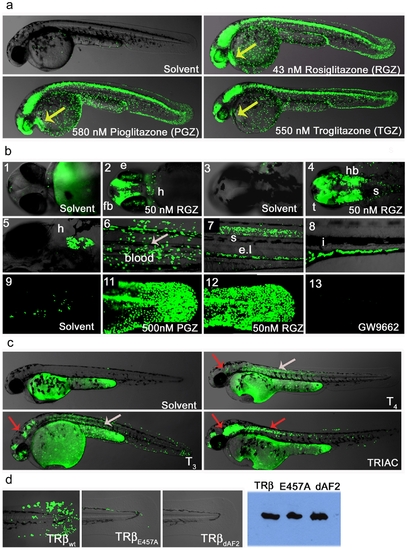
Ligand trap activities are drug responsive and reveal SNRM activities. (a) LT-PPARγ embryos show strong reporter activation in the presence of receptor specific agonist (uses as indicated). After heat pulse followed by overnight incubation with solvent or drug GFP expression in cells of the epidermis, CNS, eye, blood and heart (48 hpf; lateral view) is induced. Yellow arrow indicates GFP expression in heart. (b) Upper panel shows magnifications of embryo heads in ventral (b-1-2) and dorsal (b-3-4) orientation of 2 dpf fish treated with solvent or 50 nM Rosiglitazone (RGZ). B-2 shows reporter expression in eye (e), forebrain (fb), heart (h) and b-4 indicates GFP expression in hindbrain (hb), tectum (t) and anterior spinal cord (s). Middle panel shows drug responses in tissues of older embryos: Expression in heart (b-5; 5 dpf ventral view), in blood (b-6; 8 dpf), in the spinal cord (s) and endothelium layer ((el), b-7; 4 dpf, lateral view) and in the intestine ((I, b-8; 6 dpf). Embryos were subjected to a 30 minute heat pulse at 37°C, followed by incubation with 50 nM Rosiglitazone for 24 h. The lower panels show responses to: endogenous hormone in the tail epidermis of 3 dpf embryos treated with solvent (b-9); 500 nM Pioglitazone (b-11), 500 nM RGZ (b-12) and treatment with the antagonist GW9662 (500 nM). (c) TRβ LT embryos show tissue-specific responses to hormones and drugs. After 40 min heat induction, embryos (24 hpf) were incubated with compounds for 28 h in a 28°C incubator in the dark. Solvent (Ethanol) treated embryos show no GFP expression. T4 (2.5 μM) treated embryos show strong reporter activity in muscle and to a lesser amount in epidermis, brain and eye retina. T3 (2.5 μM) treatments result in similar responses but GFP induction in epidermis, brain and eye is stronger, and signal is also seen in blood cells. TRIAC (100 nM) treatments also induce GFP responses in brain, heart, eye, epidermis and muscle, and in addition, anterior spinal cord. Overlay pictures of bright field and GFP (75% transparent) are shown. Arrows indicate tissue-specific GFP responses: grey = muscle and red = brain. (d) TRβ responses in transgenic fish are dependent on a functional LBD. TRβwt, TRβE457A and TRβdAF2 embryos (24 hfp, F1) were heat pulsed and soaked in TRIAC (100 nM) as described in Figure 4c. The upper row shows strong (wt), weak (E457A) and no (dAF2) epidermal GFP expression in the tail. Western blot detected proteins show similar levels of TRβ transgene expression (right side). |
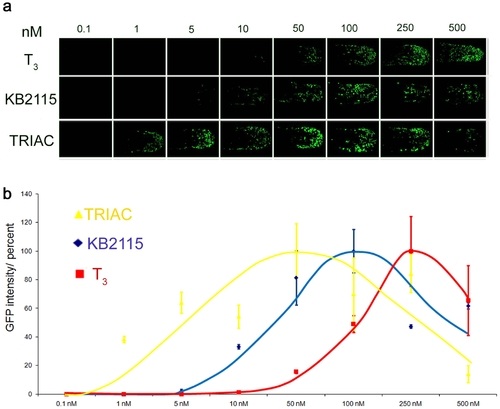
LT drug responses are quantifiable. (a) Dose dependent GFP expression Shown are the dose responses for T3, KB2115 and TRIAC in TRβ tail epidermis (48 hpf) treated embryos. Treatments were done from 0.1–500 nM. GFP images show anterior-posterior tail view (imaged at 150x magnification) (b) The graph indicates average intensity of GFP signals for each treatment in percent. GFP expression was quantified using nuclei count software from MetaX files. Values for drug treated fish are shown in yellow (TRIAC), in blue (KB2115) and in red (T3). |
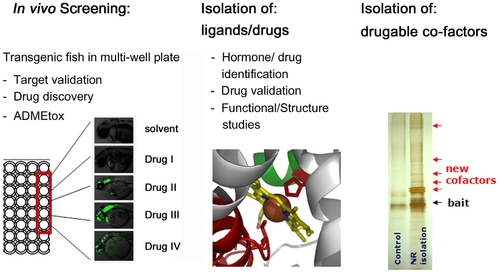
Schematic representation of LT platform functions. |

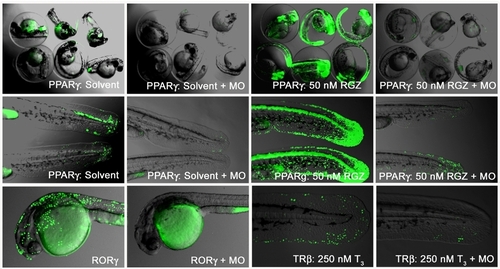
Ligand trap signals are NRs specific A Morpholino (MO) against the FSH-tag of the GAL-NR transgene was injected into one-cell stage F3 embryos of LT-PPARγ, RORγ and LT-TRβ. Endogenous and agonistic drug responses were compared between control and MO injected embryos. The upper row shows 48 hpf PPARγ embryos in their chorions, and tail close ups of the same conditions are shown in the middle row. The lower row shows RORγ (F2) or homozygous TRβ F3 embryos in the presence of 250 nM T3 with control or MO injections. |
(a/b) Expression of HIPK3 and Gal- and Gal-TR-fusion proteins in reporter assays (Figure 3e and 3f) verified by Western Blot using Flag M2 antibody. |
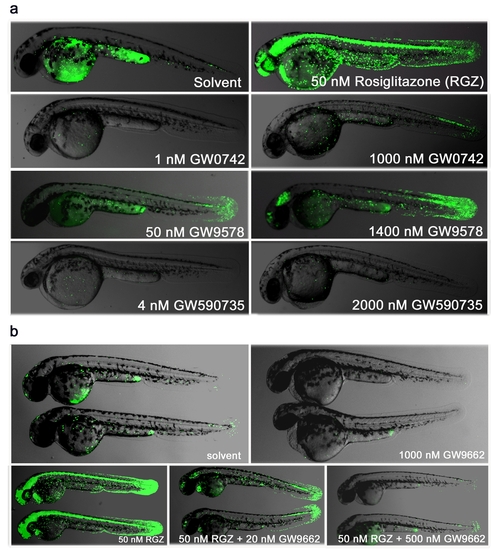
Selective PPARγ drug responses (a) At 24 hpf PPARγ embryos were subjected to a 30 minute heat shock at 37°C and then incubated for 24 hr in the presence of agonists specific for one of the three PPAR isoforms (Rosiglitazone for γ, GW0742 for δ/β and GW9578 or GW590735 for α). The concentrations chosen represent known EC50 values for the appropriate targets, along with significantly higher levels to test for cross-reactivity. Lateral views of 48 hpf embryos, anterior to the left, are shown. (b) PPARγ agonist/antagonist replacement. At 24 hpf PPARγ embryos were subjected to a 30 minute heat induction at 37°C and either incubated for 24 hr in the presence of solvent or 1000 nM GW9662 (upper row) or 50 nM Rosiglitazone (RGZ) alone or 50 nM RGZ and increasing concentrations of GW9662 (20 nM and 500 nM). Two embryos for each treatment showing lateral views at 48 hpf, anterior to the left, are shown. |