
- Title
-
RPTPalpha and PTPepsilon Signaling via Fyn/Yes and RhoA is Essential for Zebrafish Convergence and Extension Cell Movements during Gastrulation
- Authors
- van Eekelen, M., Runtuwene, V., Overvoorde, J., and den Hertog, J.
- Source
- Full text @ Dev. Biol.
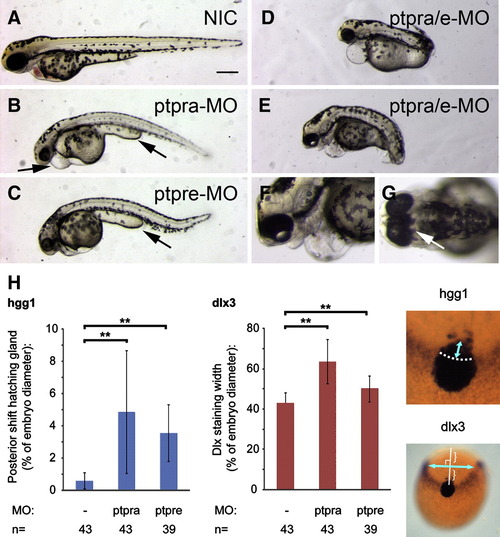
RPTPα and PTPε knockdown fish show convergence and extension defects. Wildtype zebrafish embryos were micro-injected with 0.3 ng ptpra-MO (B), 2.5 ng ptprea-MO + 2.5 ng ptpreb-MO (C) or triple injected with ptpra-MO (0.15 ng) and ptpre-MO (1 ng each, D–G) each at the 1 cell stage and grown to 48 hpf. Pictures show representative embryos. A non-injected embryo is included for reference (A). Arrows indicate shorter yolk extension (B, C), cardiac edema (B) or fused eyes (G). (H) Zebrafish embryos micro-injected with ptpra-MO (0.3 ng/embryo) or ptpre-MO (2.5 ng ptprea-MO + 2.5 ng ptpreb-MO/embryo) at the one cell stage and non-injected control embryos were grown to 1 somite stage and fixed. Whole mount in situ staining was performed using probes for dlx3 and hgg1. The resulting staining patterns were analyzed using ImageJ software, measuring the posterior shift of the hgg1 staining as indicated in the panel on the right, and measuring the width of the dlx3 staining half-way between the hatching gland and the edge of the embryo when seen from top view with the hatching gland positioned in the middle. The measured distances were plotted as the average posterior shift or width as a percentage of the total width of the embryo (yolk). Error bars indicate standard deviations, Student t-tests (2 tailed, assuming unequal variance) were performed between groups indicated, ** indicates a P-value < 0.001. Scale bars = 250 μm. Dlx3/hgg1 in situ data can be compared within experiments, but not between experiments because of subtle differences in experimental conditions. This experiment has been done at least three times. A representative experiment is depicted here. PHENOTYPE:
|
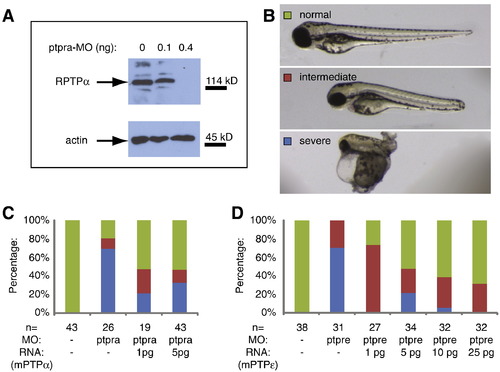
RPTPα knockdown abolished protein expression and both RPTPα and PTPε knockdowns were rescued by co-injection of RNA. (A) Zebrafish embryos were micro-injected at the 1 cell stage with ptpra-MO (0.1 ng/embryo or 0.4 ng/embryo) and grown to 52 hpf. Embryos were dechorionated, deyolked and lysed using sodium orthovanadate and protease inhibitors. Samples of non-injected control and MO injected embryos were loaded on SDS-PAGE in such a way that all samples contain equal amounts of protein. Immunoblots were analyzed for expression of RPTPα and actin as a loading control. (B–D) Zebrafish embryos were micro-injected with ptpra-MO (C) or ptpre-MO (D) with or without mRNA encoding mouse RPTPα (C) or PTPε (D). Embryos were grown to 2 dpf and phenotypes were assigned as indicated in panel B, where embryos scored as normal resemble non-injected control, embryos with overall normal looking phenotype and body plan but shortened body axis were labeled as intermediate, and embryos with severely disrupted morphology were labeled severe. |

A ptpra stop mutation phenocopied the ptpra knockdown and can be rescued by zf-ptpra mRNA. (A) A ptpra mutant (hu3334) was identified by target selected gene inactivation. Homozygous mutant (top), heterozygous (middle) and wildtype (bottom) sequences are depicted here and the TTG to TAG codon change resulting in a L133X stop in the extracellular domain is indicated. (B) Heterozygous ptpra+/- fish were in-crossed and their offspring was grown to 52 hpf. Embryos were characterized as mutant or sibling based on observed phenotype, dechorionated, deyolked and lysed using sodium orthovanadate and protease inhibitors. The resulting lysates were analyzed for RPTPα expression. Actin expression was monitored as a loading control. Heterozygous ptpra+/- fish were in-crossed and offspring embryos were photographed and genotyped at 24 hpf (C, F), 48 hpf (D, G) and 72 hpf (E, H). Mutants (A–C) and siblings (D–F) are shown. (I) Heterozygous ptpra+/- fish were in-crossed and embryos were either grown to 1 somite stage and fixed without injection, or micro-injected at the one cell stage with 10 pg/embryo zf-ptpra mRNA and then grown to 1 somite stage and fixed. Whole mount in situ staining was performed using probes for dlx3 and hgg1. The resulting staining patterns were analyzed by measuring the posterior shift of the hatching gland and the width of the dlx3 staining as described in Fig. 2H. After pictures were taken embryos were lysed and genotyped. The average posterior shift of the hatching gland (hgg1) or width of the dlx3 staining is plotted as a percentage of the embryo (yolk) diameter. (J) Heterozygous ptpra+/- fish were in-crossed and embryos were grown to 8 somite stage and fixed, or wildtype embryos were micro-injected at the one cell stage with 0.3 ng/embryo ptpra-MO or ptpre-MO and then grown to 8 somite stage and fixed. Whole mount in situ staining was performed using probes for krox20 and myod. The resulting staining patterns were analyzed by measuring the rhombomere width and the distance from the 1st to the 8th somite. Ptpra incross embryos were subsequently genotyped. For each group a representative embryo is shown. The rhombomere width and the distance from the 1st to the 8th somite were measured. The resulting ratio was plotted (K). Mutant and knockdown embryos were compared to wildtype embryos. Error bars in all graphs indicate standard deviations, Student t-tests were performed (2 tailed, assuming unequal variance) between indicated groups where ** indicates a P-value < 0.001, * a P-value < 0.05 and no asterisk indicates no significant difference, P-value > 0.05. Scale bars = 250 μm. PHENOTYPE:
|
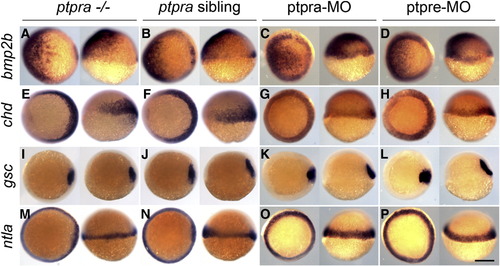
No cell specification defects in ptpra mutant or RPTPα and PTPε knockdown embryos. Embryos were fixed at 6 hpf and whole mount in situ hybridization was performed using probes for bmp2b, chordin (chd), gooscoid (gsc) or no tail (ntla). Embryos from ptpra+/- incrosses were processed and genotyped after in situ hybridization. Alternatively, embryos injected at the 1-cell stage with ptpra-MO (0.3 ng/embryo) or ptpre-MO (2.5 ng ptprea-MO + 2.5 ng ptpreb-MO/embryo) were used. Each panel depicts on the left: animal pole view with dorsal to the right; on the right: lateral view with dorsal to the right. Scale bar = 250 μm. |

Decreased convergence and extension cell migration speed and cell intercalation in ptpra-/- mutant. Image processing used for cell tracking in order to quantify migration speeds: (A) original single Z-slice image acquired by confocal imaging of a wildtype embryo micro-injected with fluorescently labeled Histone 1 protein, (B) binary image, (C) binary image processed by watershedding, (D) all objects are eroded to a single pixel (inset shows 4x magnification for clarity), (E) every pixel is dilated, (F) projection of the resulting objects used for tracing onto the original image, (G) tracks generated by tracking algorithm projected onto the original image, (H) tracks generated by tracking algorithm projected onto the original image; the yellow rectangle indicates the area where tracks for extension speeds are collected, the blue rectangle represents the area where tracks for convergence speeds are collected. (I) Ptpra+/- fish were in-crossed and embryos were injected with Alexa Histone 1. Subsequently, 4–6 embryos were imaged in parallel using confocal microscopy starting from shield stage. Images were processed as described above and average cell migration speed was calculated by dividing the track length by the number of frames. For every experiment the average speed was calculated in either the convergence or the extension direction for typically more than 1000 cells per embryo. The embryos were subsequently genotyped and the average convergence and extension speeds in ptpra-/- mutant embryos were plotted as a percentage of the average speeds in wildtype siblings for every experiment individually. The average of the 3 experiments is indicated as well. As a positive control, convergence and extension speed was determined in wnt11 knockdown embryos, that are well known to have convergence and extension cell movement defects. The average reduction determined in 3 independent experiments is shown. (J) Ptpra+/- fish were in-crossed and embryos were injected with YFP-CAAX and H2A-mCherry RNA. Embryos were mounted and imaged at late gastrulation stage posterior of the future site of the first somite in the region next to the notochord. After imaging embryos were genotyped. Shown are mutant and wildtype embryos. Obtained images were processed and the angles of cells were determined using ImageJ software and Shape_Descriptor1u plugin (Syverud et al., 2007). Resulting angles are from 2 mutant embryos and 2 wildtype embryos and are plotted in a rose diagram (K). Length and width of the cells were determined in a similar fashion and the ratios were plotted (L). Mutants were compared to wildtype data using Student t-test, error bars represent standard deviation, asterisk indicates a P-value < 0.001. PHENOTYPE:
|
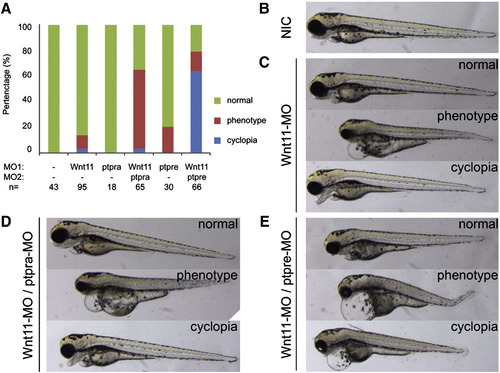
RPTPα and PTPε knockdown phenotypes were enhanced by wnt11 knockdown and induced cyclopia. (A) Zebrafish embryos were injected with low amounts of morpholino targeting RPTPα (0.15 ng/embryo), PTPε (1 ng each/embryo) and Wnt11 (2 ng/embryo) and grown to 3 dpf. Embryos were scored based on morphology “cyclopia” when eyes were fused, as “phenotype” when shorter, showing abnormal morphology and/or edemas, or as “normal”. The percentages of embryos with phenotypes were plotted. Representative embryos from each (co-)injection are depicted in panels B–E. PHENOTYPE:
|
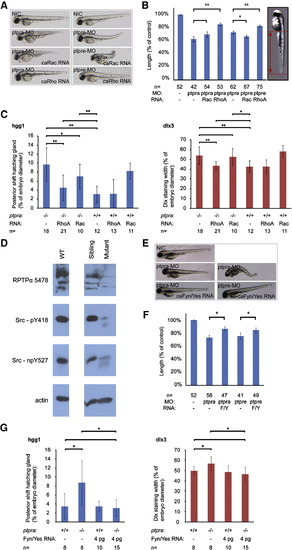
RPTPα and PTPε knockdown rescued by active RhoA or active Fyn and Yes. (A) Zebrafish embryos were micro-injected at the 1-cell stage with ptpra-MO (0.3 ng/embryo) or ptpre-MO (2.5 ng ptprea-MO + 2.5 ng ptpreb-MO/embryo) alone or co-injected with active Rac (1 pg/embryo) or RhoA (1 pg/embryo) mRNA. Embryos were grown to 2 dpf. Morpholino knockdown and RNA co-injection rescue experiments were done in the same clutch of embryos. The figure depicts representative embryos for every group from two independent experiments. (B) The phenotypes of all individual fish depicted in (A) were assessed by measuring tail lengths using ImageJ software. Tail lengths were depicted as a percentage of the length of non-injected control embryos. The figure represents the results of two independent experiments, where morpholino knockdown and RNA co-injection rescue experiments were performed in the same clutches of embryos. RNA co-injections were compared to their respective morpholino injections and Student t-tests were applied. * represents a P-value < 0.05, ** represents a P-value < 0.001, no asterisk represents no significant difference (P > 0.05). (C) Heterozygous ptpra+/- fish were in-crossed and offspring embryos were micro-injected at the 1-cell stage with either active Rac or active RhoA mRNA. Non-injected embryos were taken as a control. Embryos were grown to 1 somite stage and fixed. Whole mount in situ staining was performed using probes for dlx3 and hgg1. The resulting staining patterns were analyzed as described in Fig. 2H, by measuring the posterior shift of the hatching gland and the width of the dlx3 staining. After pictures were taken and phenotypes were assigned, embryos were lysed and genotyped. The average posterior shift or width of the dlx3 is plotted as a percentage of the embryo (yolk) diameter. (D) Heterozygous ptpra+/- or wildtype (WT) fish were in-crossed and their offspring was grown to 52 hpf. Embryos were characterized as mutant or sibling based on observed phenotype, dechorionated, deyolked and lysed using sodium orthovanadate and protease inhibitors. Western blots were run and probed using 5478-anti RPTPα serum, Src-pY418 antibody, Src-npY527 antibody and actin antibody as a loading control. (E) Embryos were injected with ptpra-MO (0.3 ng/embryo) or ptpre-MO (2.5 ng ptprea-MO + 2.5 ng ptpreb-MO/embryo) like in figure (A) and co-injections were done with active Fyn and Yes (4 pg each/embryo) RNA. Figure represents two separate experiments; morpholino injection and RNA co-injections were done in the same clutches of embryos. A representative embryo for each injected group is shown. (F) The lengths of the embryos′ tails were measured and the average was plotted. (G) Heterozygous ptpra+/- fish were in-crossed and embryos were micro-injected in a similar fashion as in (C) with 4 pg/embryo of both active Fyn and Yes mRNA. The embryos were stained for dlx3 and hgg1, analyzed and genotyped and the posterior shift of the hatching gland and the width of the dlx3 staining were plotted for each group. Error bars in all graphs represent standard deviations. Student t-tests were performed between indicated groups, where ** indicates a P-value < 0.001, * a P-value < 0.05 and no asterisk no significant difference (P-value > 0.05). EXPRESSION / LABELING:
|
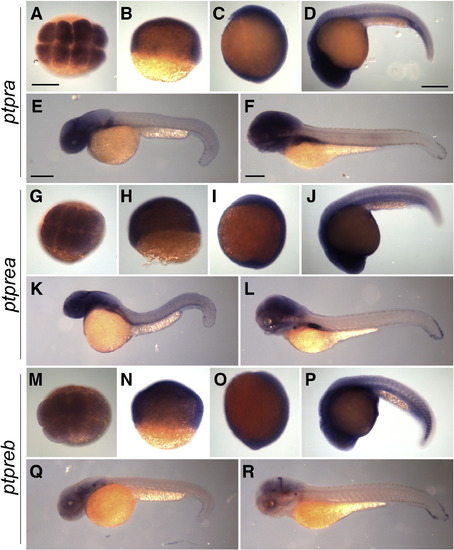
ptpra, ptprea and ptpreb are ubiquitously expressed during early zebrafish development. Wildtype zebrafish embryos were collected and fixed at 8 cell stage (A, G, M), 6 hpf (B, H, N), 1 somite stage (C, I, O), 24 hpf (D, J, P), 36 hpf (E, K, Q) and 72 hpf (F, L, R). Whole mount in situ hybridization was performed using probes targeting ptpra (A–F), ptprea (G–L) or ptpreb (M–R). Scale bars = 250 μm. EXPRESSION / LABELING:
|

Unillustrated author statements |
Reprinted from Developmental Biology, 340(2), van Eekelen, M., Runtuwene, V., Overvoorde, J., and den Hertog, J., RPTPalpha and PTPepsilon Signaling via Fyn/Yes and RhoA is Essential for Zebrafish Convergence and Extension Cell Movements during Gastrulation, 626-639, Copyright (2010) with permission from Elsevier. Full text @ Dev. Biol.