
- Title
-
A laser pointer driven microheater for precise local heating and conditional gene regulation in vivo. Microheater driven gene regulation in zebrafish
- Authors
- Placinta, M., Shen, M.C., Achermann, M., and Karlstrom, R.O.
- Source
- Full text @ BMC Dev. Biol.
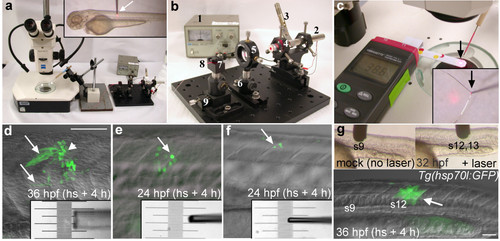
The laser-pointer optical microheater and local hsp70l:GFP transgene induction. (a) Laser pointer light was focused through a lens onto the end of a 13″ long optic fiber that was mounted on a micromanipulator under a stereomicroscope. Inset shows the coated end of the optical fiber (arrow) contacting the trunk of a 72 hpf zebrafish larva mounted in agarose. (b) Close-up view of the laser pointer microheater assembly. (1) Variable power supply (2) 75 mW red beam laser pointer, (3) clamp to depress the laser pointer switch, (4) laser pointer holder, (5) lens, (6) post holder, (7) fiber clamp, (8) 50 μm core optical fiber, (9) translation stage. (c) Digital thermometer used to determine the temperature of the laser tip (arrow). Inset shows close-up of the heater tip contacting a k-type thermocouple (black arrow). (d-f) Examples of local transgene activation in Tg(hsp70l:GFP) embryos, lateral views of the trunk (see A inset). Somitic tissue was heated for 25 minutes using different sized fiber tips calibrated to 41°C. Insets show different sized tips over a micrometer. (d) GFP expressing muscle fibers (arrows) in a 36 hpf embryo 4 hours after heat shock (120 μm diameter (50 μm core) optical fiber tip). (e) GFP expressing cells (arrow) in a 24 hpf embryo 4 hours after heat shock using a 50 μm diameter tip. (f) GFP expression in a few lateral cells of a 24 hpf embryo 4 hours after local heat shock using a 30 μm diameter tip. (g) Mock treatment (no laser light) in the region of somite 9 (left inset) did not activate gene expression. Local heat shock in the region of somite 12 (right inset) in the same embryo activated transgene expression in somites 12 and 13 (arrow). Scale bars: d-f, 100 μm; g, 50 μm. |
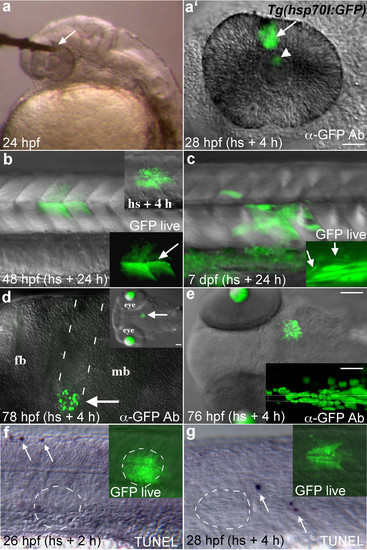
GFP expression in Tg(hsp70l:GFP) embryos following local heat shock. (a) A 50 μm diameter microheater tip (arrow) touching the eye of a 24 hpf embryo mounted in low melting temperature agarose. (a′) GFP expressing cells (arrow) were seen in the heated region 4 hours later. GFP fluorescence is also seen reflected by the lens (arrowhead). (b) GFP expression (arrows) in a 48 hpf transgenic embryo heat shocked 24 h earlier in the trunk with a 100 μm optical fiber tip. Muscle fiber morphology in GFP expressing cells is normal (arrow in lower inset). Upper inset shows GFP expression 4 h after heat shock. (c) Transgene activation in a 7 dpf larva that was heat shocked at 6 dpf. Inset shows normal spinal neuron morphology (arrows) in a different individual. (d) A 50 μm tip was pushed into the brain of this embryo at 72 hpf to locally heat deep tissue (arrows, dotted lines show entry pathway). Lateral view of the brain, dorsal up. Transgene expression was activated with relatively little damage from the optical fiber. Inset shows the region of gene activation in a dorsal view. Lens tissue fluoresces in this transgenic line at these later developmental stages. (e) Dorsal view of GFP expression in the midbrain of a 76 hpf larva 4 hours after heat shock. Inset shows a resliced (xz) view of the GFP expression domain (maximum intensity projection along the y axis), dorsal up. GFP expression was activated in cells ∼30 μm away from the dorsal surface that contacted the fiber optic tip. (f, g) TUNEL labeling in the trunk region 2 and 4 hours after heat shock, arrows indicate labeled apoptotic cells. No increased cell death was seen in the area of local heat shock (dashed circles). Insets show GFP expression just prior to fixation. Lateral views. Scale bars: a-d, f, g, 50 μm; e, 100 μm, inset, 30 μm. |
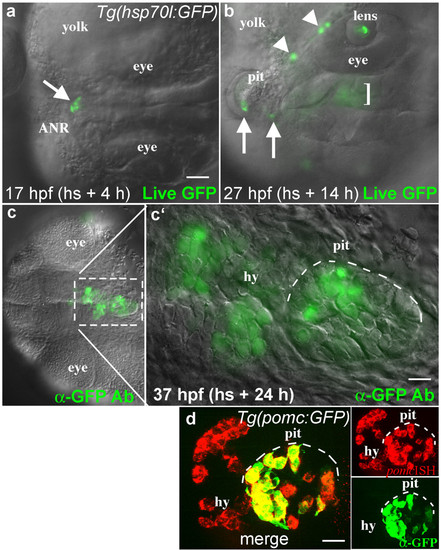
Lineage tracing by local activation of the hsp70l:GFP transgene. (a, b) Dorsal views of a live Tg(hsp70l:GFP) embryo, anterior to the left. (a) GFP expression in 4-6 cells at the anterior neural ridge (ANR, arrow) 4 h after local heat shock. (b) In the same embryo 14 h after heat shock, GFP expressing cells were present in known derivatives of this region including the forming pituitary placode (pit, arrows), marginal epidermis (arrowheads), lens, and hypothalamus (bracket, these ventral cells are out of focus in this dorsal view). (c, c′) Ventral views (anterior left) of the same embryo following anti-GFP antibody labeling. 24 h after local heat shock, GFP positive cells were seen in the hypothalamus (hy) and adenohypophysis of the pituitary (pit, white dashed line). (d) In a different experiment, anti-GFP antibody labeling (green) was combined with fluorescent in situ hybridization to visualize gene expression (red). The endogenous pomc gene is expressed in endocrine cells of the hypothalamus (hy) and pituitary (pit). In the Tg(pomc:GFP) line, GFP is expressed only in POMC cells of the pituitary (pit), while POMC cells in the hypothalamus do not express GFP [29]. Merged image shows overlapping expression (yellow) in individual pituitary cells. Scale bars: a-c, 50 μm; c′, 10 μm; d, 20 μm. |