
|
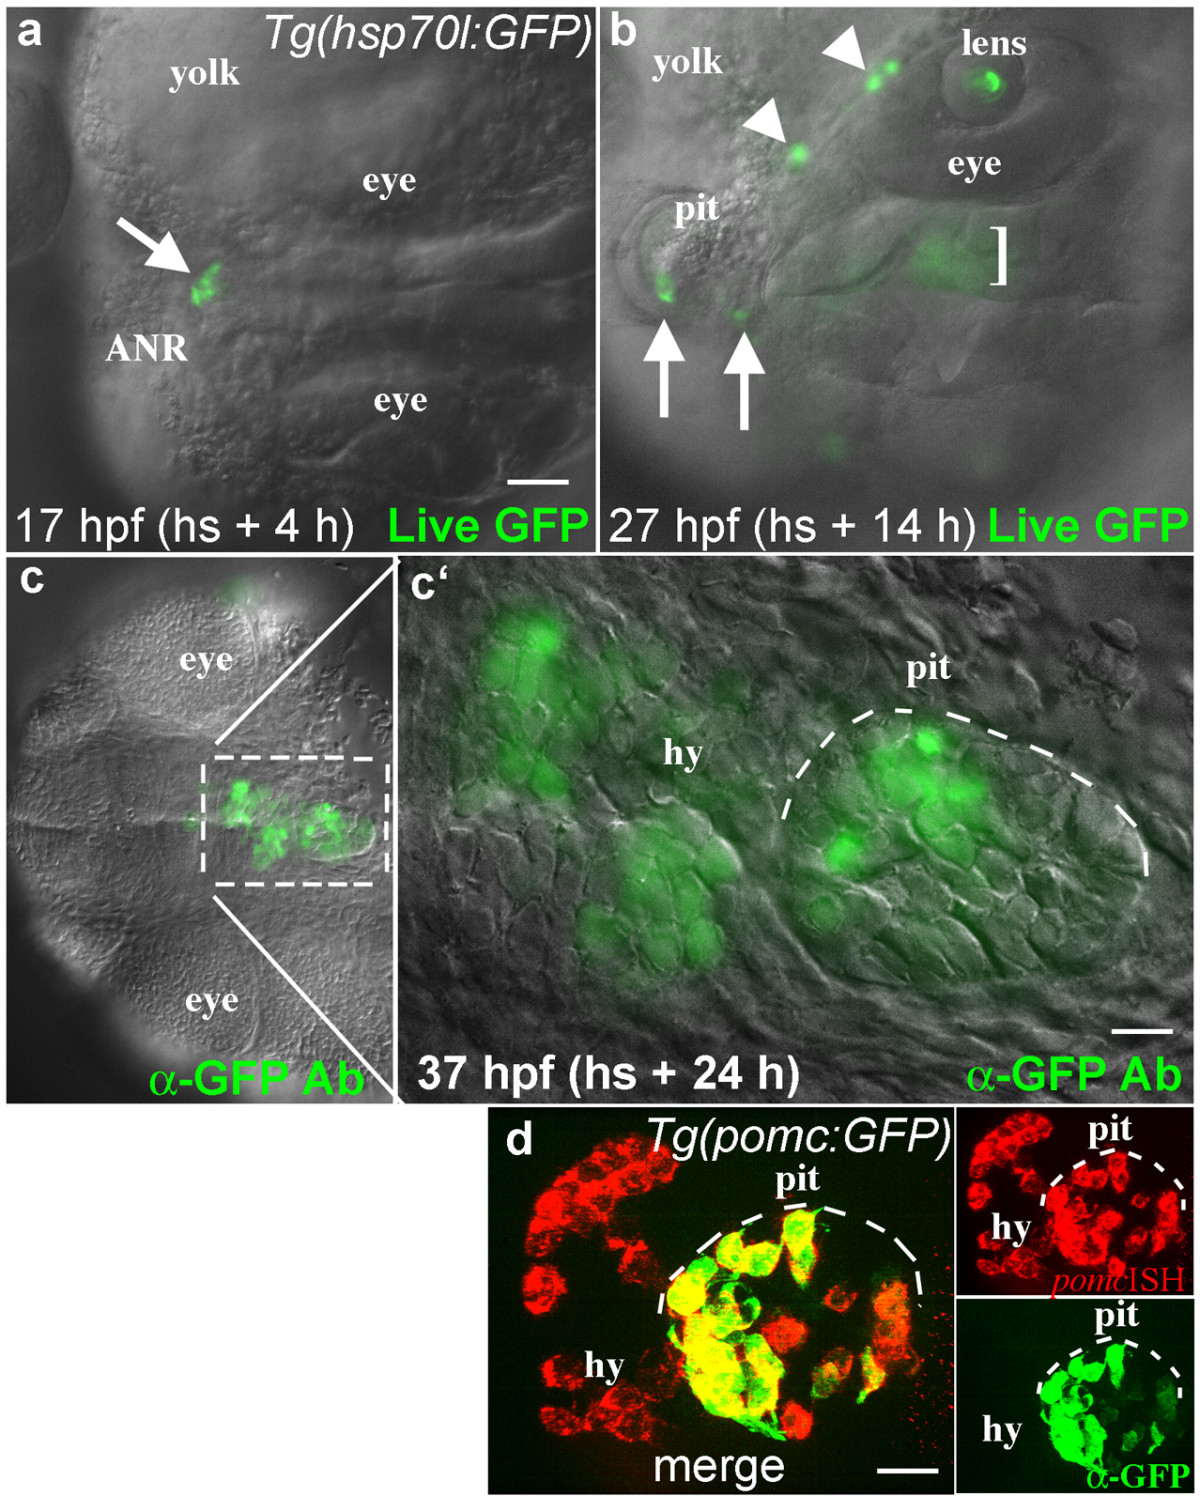
Fig. 3 Lineage tracing by local activation of the hsp70l:GFP transgene. (a, b) Dorsal views of a live Tg(hsp70l:GFP) embryo, anterior to the left. (a) GFP expression in 4-6 cells at the anterior neural ridge (ANR, arrow) 4 h after local heat shock. (b) In the same embryo 14 h after heat shock, GFP expressing cells were present in known derivatives of this region including the forming pituitary placode (pit, arrows), marginal epidermis (arrowheads), lens, and hypothalamus (bracket, these ventral cells are out of focus in this dorsal view). (c, c′) Ventral views (anterior left) of the same embryo following anti-GFP antibody labeling. 24 h after local heat shock, GFP positive cells were seen in the hypothalamus (hy) and adenohypophysis of the pituitary (pit, white dashed line). (d) In a different experiment, anti-GFP antibody labeling (green) was combined with fluorescent in situ hybridization to visualize gene expression (red). The endogenous pomc gene is expressed in endocrine cells of the hypothalamus (hy) and pituitary (pit). In the Tg(pomc:GFP) line, GFP is expressed only in POMC cells of the pituitary (pit), while POMC cells in the hypothalamus do not express GFP [29]. Merged image shows overlapping expression (yellow) in individual pituitary cells. Scale bars: a-c, 50 μm; c′, 10 μm; d, 20 μm.