
- Title
-
Expression of the oscillating gene her1 is directly regulated by hairy/enhancer of split, T-box, and suppressor of hairless proteins in the zebrafish segmentation clock
- Authors
- Brend, T., and Holley, S.A.
- Source
- Full text @ Dev. Dyn.

The anterior stripe element (ASE) of the zebrafish her1 gene. A: Structure of the her1 genomic locus indicating the limits of known cis-regulatory regions. The ASE is located between 3.3 kb and 2.9 kb upstream of the her1 coding sequence. B: Complete sequence of the ASE. Binding sites for Her proteins (E1 and E2) and Tbx proteins (T1) identified in this study are indicated by red and blue ellipses, respectively. Underlining indicates putative sites for Her proteins (red) and Tbx proteins (blue) which were tested but did not bind in our assay. C: In situ hybridization of a 10-somite stage zebrafish embryo showing expression of her1 in the presomitic mesoderm (PSM). The subset of the expression pattern that is controlled by the ASE is boxed. EXPRESSION / LABELING:
|
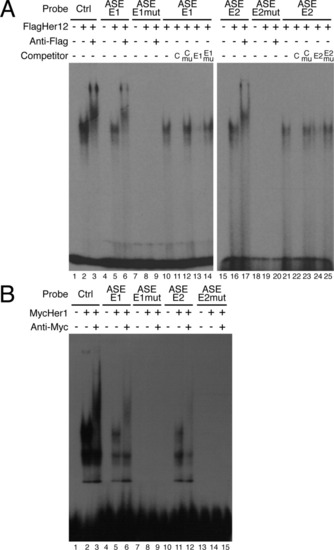
Identification of Her protein binding sites within the anterior stripe element (ASE). A: Two Her protein binding sites were identified in the ASE (lanes 4-6 and 15-17). Control reactions contained unprogrammed lysate (lanes 1, 4, and 15). FlagHer12 forms a single complex with the control E-box, ASE-E1, or ASE-E2 probes (lanes 2, 5, and 16). Specificity of binding was confirmed by supershifting complexes with an anti-Flag antibody (lanes 3, 6, and 17). Mutation of the E-box in the ASE-E1 or ASE-E2 probe abolished Her12 binding (lanes 7-9 and 18-20). Sequence specific binding was confirmed by competition assays (lanes 10-14). Reciprocal competition was observed between the control and ASE-E1 oligonucleotides (lanes 11 and 13). Oligonucleotides containing mutated E-boxes were unable to compete (lanes 12 and 14). An equivalent analysis was performed for the E2 site (lanes 15-25). Unlabeled competitors were added at 100-fold molar excess. B: Her1 also binds to the E1 and E2 sites. Control reactions contained unprogrammed lysate (lanes 1, 4, 7, 10, and 13). Proteins from MycHer1 synthesis reactions formed three complexes with the control E-box, ASE-E1 or ASE-E2 probes (lanes 2, 5, and 11). However, only one of these complexes could be supershifted using an anti-Myc antibody (lanes 3, 6, and 12), indicating that the other bands are likely experimental artifacts. Mutation of the E-box in the ASE-E1 or ASE-E2 probe eliminated Her1 binding (lanes 7-9 and 13-15). |
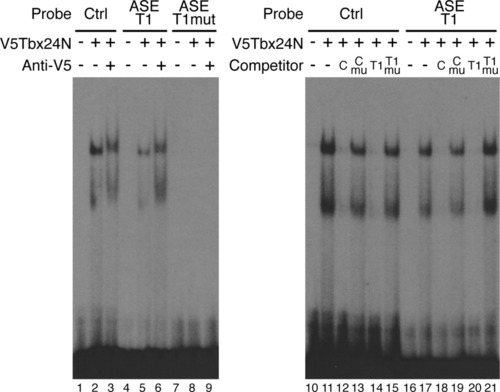
Identification of a Tbx binding site within the anterior stripe element (ASE). A single Tbx24 binding site in the ASE was confirmed by electrophoretic mobility shift assays (EMSA; lanes 4-6). Control reactions contained unprogrammed lysate (lanes 1, 4, and 7). Tbx24N formed two complexes with the control T-box site and ASE-T1 probe (lanes 2 and 5). The faster migrating band is likely due to a truncated protein product in the in vitro translation reaction (data not shown). Specificity of binding was confirmed by supershifting complexes with an antibody to the V5 epitope (lanes 3 and 6). Mutation of the T-box in the ASE-T1 sequence abolished Tbx24N binding (lanes 7-9). Binding specificity was further confirmed by competition assays (lanes 10-21). Reciprocal competition was observed between the control and ASE-T1 oligonucleotides (lanes 12, 14, 18, and 20). Oligonucleotides containing mutated T-box sites were unable to compete (lanes 13, 15, 19, and 21). competitors were added at 100-fold molar excess. |
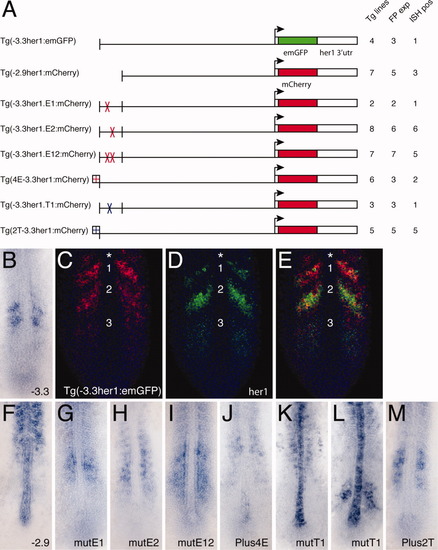
Transgenic analysis of the function of protein binding sites in the anterior stripe element (ASE). A: Schematic representation of the transgenic constructs used to analyze the function of protein binding sites within the ASE. For each construct: Tg lines = the total number of transgenic lines identified, including those only detected by polymerase chain reaction; FP exp = the number of transgenic lines in which expression was observable by fluorescence; ISH pos = the number of transgenic lines that exhibited expression that was detectable by in situ hybridization. B: Standard in situ hybridization for emGFP mRNA in a transgenic embryo carrying the (-3.3her1:emGFP) construct. GFP, green fluorescent protein. C-E: Double fluorescent in situ hybridization of a Tg(-3.3her1:emGFP) embryo, showing either emGFP (C, red) or her1 (D, green) expression, or both (E). Nuclei stained with propidium iodide are colored blue. The same confocal section is shown in all panels. Numbers indicate specific stripes of gene expression as referenced in the text. Asterisk indicates the additional more anterior stripe seen in transgenic embryos. A: Standard in situ hybridizations showing reporter gene (emGFP or mCherry) expression in transgenic embryos carrying the indicated constructs. EXPRESSION / LABELING:
|
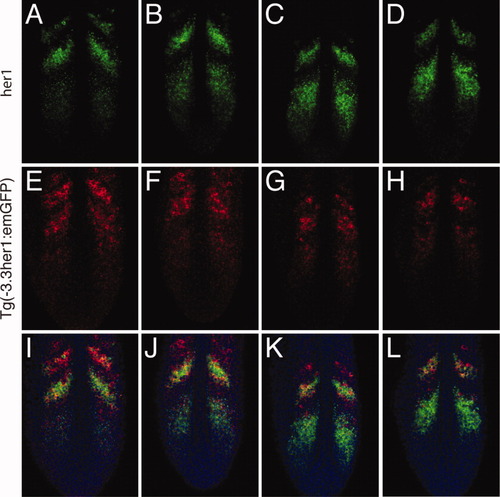
The -3.3-kb enhancer does not accurately recapitulate her1 expression in the anterior presomitic mesoderm (PSM). Double fluorescent in situ hybridization of four Tg(-3.3her1:emGFP) embryos. GFP, green fluorescent protein. Three images of a single confocal section are shown for each embryo: (A,E,I), (B,F,J), (C,G,K), and (D,H,L), respectively. A-D: Expression of her1. Embryos are arranged to indicate progression of waves of her1 transcription through the somitogenesis cycle. E-H: Expression of emGFP mRNA. I-L: Merged images showing expression of her1 (green) and emGFP (red). Nuclei stained with propidium iodide are colored blue. |
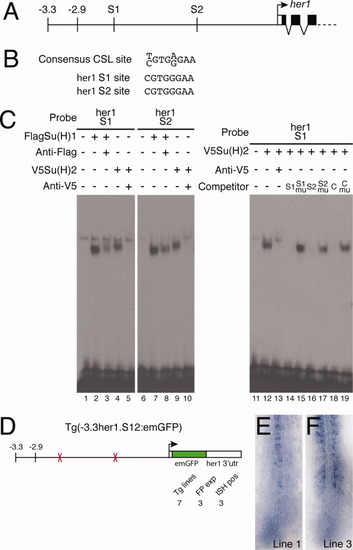
Su(H) binding sites within the -2.9-kb region are necessary for her1 expression. A: Representation of part of the her1 genomic locus indicating the position of the two Su(H) binding sites (S1 and S2). B: The S1 and S2 sequences are perfect matches for the consensus CSL binding site. C: Electrophoretic mobility shift assays (EMSA) experiments confirm that the S1 and S2 sites bind both Su(H)1 and Su(H)2 (lanes 1-10). Control reactions contained unprogrammed lysate (lanes 1 and 6). A weak nonspecific complex is seen in every lane. Specificity of binding was confirmed by supershifting or blocking complexes with antibodies to the appropriate epitope tag (lanes 3, 5, 8, and 10). Recognition of specific sequences was confirmed by competition assays (lanes 11-19). Unlabeled competitor oligonucleotides were added at 100-fold molar excess. The C indicates the control oligonucleotide including the SPS motif from the mouse Hes1 gene; mu indicates competitors in which the CSL site was deleted (lanes 15 and 17) or mutated (lane 19). D: Schematic representation of the construct used to analyze the function of the two Su(H) binding sites. The total number of transgenic lines are indicated (Tg lines), as are the number of lines in which expression was detected by fluorescence (FP exp) and in situ hybridization (ISH pos). E,F: In situ hybridization of Tg(-3.3her1.S12:emGFP) embryos from two different lines showing expression of emGFP mRNA. |