
- Title
-
Nrarp coordinates endothelial Notch and Wnt signaling to control vessel density in angiogenesis
- Authors
- Phng, L.K., Potente, M., Leslie, J.D., Babbage, J., Nyqvist, D., Lobov, I., Ondr, J.K., Rao, S., Lang, R.A., Thurston, G., and Gerhardt, H.
- Source
- Full text @ Dev. Cell
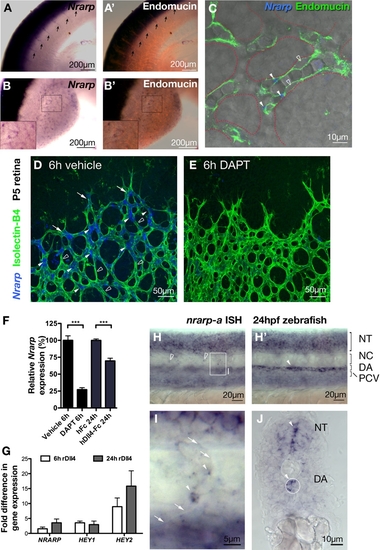
Endothelial Nrarp Expression Is Regulated by Notch Signaling (A–C) In situ hybridization (ISH) of mouse Nrarp in mouse embryonic (E10.5) intersomitic vessels (arrows in [A]) and limb bud vessels ([B and C]; Endomucin, red). (C) Single plane confocal LSM image of limb bud vessels outlined with dotted red line (ISH reflection signal, blue; transmitted light; endomucin, green). Nrarp is more strongly expressed by ECs at branch points (filled arrowheads in [C]) compared to ECs in between (stroked arrowheads in [C]). (D–G) Notch signaling positively regulates endothelial Nrarp expression. Whole-mount retina ISH shows high Nrarp expression (blue) in ECs (stained with Isolectin-B4, green) often located at vessel branch points in vehicle-treated P5 retinas (filled arrowheads, [D]) and absent in between branch points (stroked arrowheads). Endothelial stalk cells with Nrarp expression are indicated by arrows. Endothelial Nrarp expression decreased after 6 hr of DAPT treatment (E). (F) qPCR, relative expression of Nrarp in the retinas of P5 C57Bl6/J mice treated with DAPT (6 hr) or Dll4-Fc (24 hr). ***, p ≤ 0.0004. Vehicle and DAPT treatments, n ≥ 7; hFc, n = 4; Dll4-Fc, n = 6. Data show mean ± SEM, n = animals. (G) HUVECs were stimulated with rDll4 for 6 or 24 hr. Fold increase in NRARP, HEY1 and HEY2 expression are shown. n = 3. (H–J) nrarp-a ISH in 24 hpf zebrafish embryos. (H) and (H′) are lateral views of the same region in the zebrafish trunk taken at different focal planes. The boxed region in (H) is magnified in (I). (J) is a transverse section of the zebrafish trunk. nrarp-a is expressed in ECs of ISV (arrowhead, [I]) and in cells located between somite boundaries (empty arrowheads, [H]). nrarp-a is also expressed in the DA and in the neural tube (H′, J). Arrows in (I) indicate somite boundary. NT, neural tube; NC, notochord; DA, dorsal aorta; PCV, posterior cardinal vein. EXPRESSION / LABELING:
|
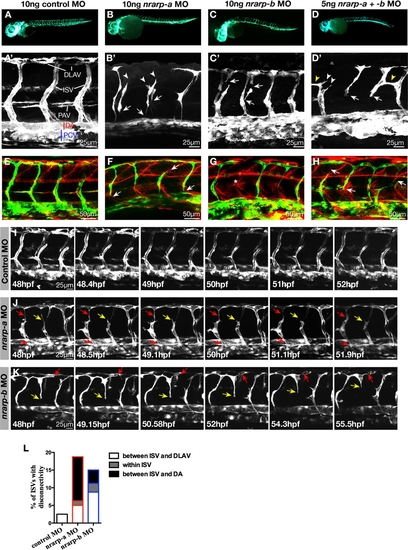
Knockdown of nrarp-a and nrarp-b in Zebrafish Leads to Abnormal Intersegmental Vessel Formation (A–D) Tg(fli1:EGFP)y1 zebrafish were injected with 10 ng control (A), nrarp-a (B), nrarp-b (C), or 5 ng each of nrarp-a and -b (D) morpholinos and analyzed at ∼56 hpf. (B′–D′) nrarp-a and -b morphants show defective ISVs. Arrows indicate disconnected vessels; arrowheads indicate ISVs with delayed dorsal migration; yellow arrowheads show misdirected ISV formation. Anterior of embryos is to the left. DLAV, dorsal longitudinal anastomotic vessel; ISV, intersegmental vessel; PAV, parachordal vessel; DA, dorsal aorta; PCV, posterior cardinal vein. (E–H) Whole-mount collagen XII (red) staining in 48 hpf zebrafish Tg(fli1:EGFP)y1 embryos. Normal myotome boundaries are observed in nrarp-a, -b, and double nrarp-a and –b morphants (F–H). Arrows indicate disconnected vessels. * in (G) indicates missing ISV at the myotome boundary. (I–K) Confocal time-lapse stills of control (I) and nrarp-a (J) or nrarp-b (K) morphants between 48 and 56 hpf. The ISVs of control morphants remained connected to the DA and DLAV (I). Note that the middle and right ISVs of the control morphant is out of focus. ISVs in nrarp-a and -b morphants regress over time (J and K). In (J), red arrows indicate poor connection between vessels and yellow arrow points to a regressing vessel. In (K), red arrow points to regressing vessel along the path of DLAV formation; yellow arrow indicates detachment of ISV from DA. (L) Quantification of vessel disconnection. Graph shows the percentage of ISVs with disconnection between the ISV and DA, within the ISV, or between the ISV and DLAV. Ten embryos (8 ISVs/embryo) were analyzed for each morphant. PHENOTYPE:
|
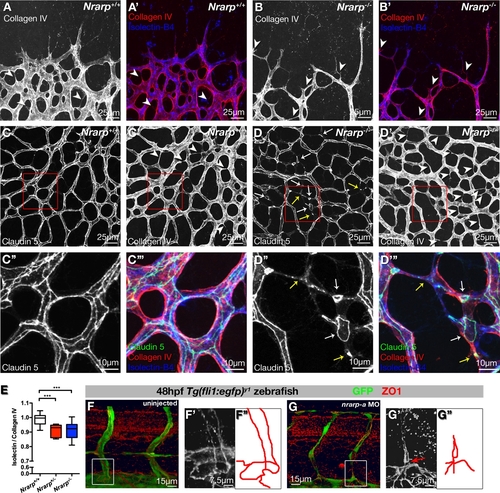
Loss of Nrarp Expression Causes Vessel Regression in Mouse and Zebrafish (A and B) Nrarp-/- retinas display ectopic vessel regression at vascular front. P5 Nrarp+/+ and Nrarp-/- retinas labeled for Isolectin-B4 (blue) and collagen IV (red). Arrowheads highlight empty collagen IV sleeves, indicating vessel regression. (C and D) P6 Nrarp+/+ and Nrarp-/- retinas labeled for Claudin 5 (green in [C″′ and D″′]), collagen IV (red in [C″′ and D″′]), and Isolectin-B4 (blue in [C″′ and D″′]). Increased vessel regression (arrowheads, [D′]) associates with discontinuous endothelial junctions in Nrarp-/- retinas (arrows, [D]). (D″) and (D″′) correspond to boxed regions in (D) and (D′). Yellow arrows indicate punctate Claudin 5 staining; white arrows point to loss of Claudin 5 continuity between vessels. (E) Ratio of Isolectin-B4-positive vessels to collagen IV-positive vessels. Values below 1 indicate vessel regression. ***, p < 0.0005. Nrarp+/+, n = 13; Nrarp+/-, n = 8; Nrarp-/-, n = 20. (F and G) Zona occludens 1 (ZO1, red) staining in uninjected and nrarp-a MO-injected Tg(fli1:EGFP)y1 zebrafish embryos at 48 hpf. (F′) and (G′), high magnification Z-stacks of boxed regions in (F) and (G). Endothelial junctions (illustrated by red tracing) between the ISV and DA are poorly developed in nrarp-a morphants (arrow in [G′]). PHENOTYPE:
|
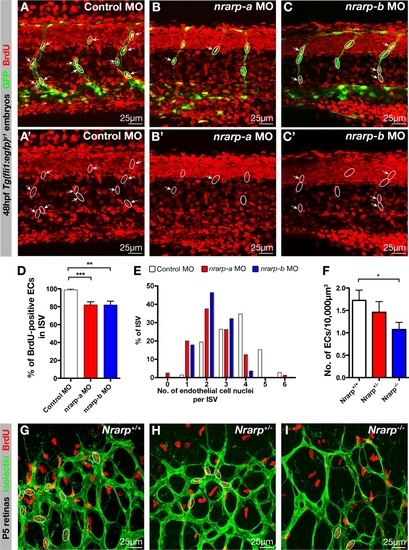
Decreased EC Proliferation in Nrarp-/- Mouse and in nrarp-a and nrarp-b Morphants (A–D) Control, nrarp-a and -b MO-injected Tg(fli1:EGFP)y1 zebrafish embryos were exposed to BrdU (red) from 19 to 48 hpf. Circles highlight ECs nuclei along ISVs. Arrows indicate BrdU-positive ECs. (D) Quantification of BrdU-positive ECs in ISVs. Error bars indicate SEM. Control, n = 8 (31 ISVs); nrarp-a, n = 6 (47 ISVs); nrarp-b, n = 14 (66 ISVs). (E) Decrease in EC number in ISVs of nrarp-a and -b morphants. Bar graph shows the percentage of ISVs containing x number of endothelial nuclei per ISV at 48 hpf. Control MO, n = 17; nrarp-a MO, n = 16; nrarp-b MO, n = 21. Eight ISVs/embryo were analyzed. (F–I) 3 hr BrdU incorporation assay in P5 mice. Bar graph shows number of proliferated ECs in 10,000μm3 retinal vessels (F). *, p = 0.0328. Nrarp+/+, n = 17, Nrarp+/-, n = 8; Nrarp-/-, n = 14 images. Data show mean ± SEM. (G–I) Circles highlight BrdU-positive ECs in Nrarp+/+, Nrarp+/-, and Nrarp-/- retinas stained with Isolectin-B4 (green) and BrdU (red). PHENOTYPE:
|
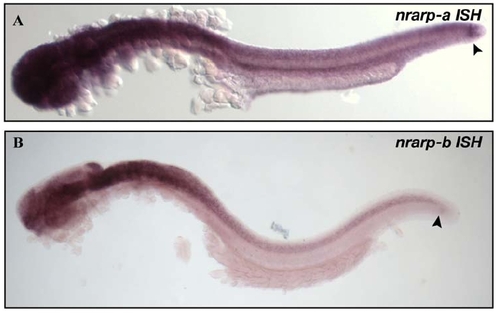
nrarp-a and nrarp-b Expression in Zebrafish Embryos EXPRESSION / LABELING:
|
Reprinted from Developmental Cell, 16(1), Phng, L.K., Potente, M., Leslie, J.D., Babbage, J., Nyqvist, D., Lobov, I., Ondr, J.K., Rao, S., Lang, R.A., Thurston, G., and Gerhardt, H., Nrarp coordinates endothelial Notch and Wnt signaling to control vessel density in angiogenesis, 70-82, Copyright (2009) with permission from Elsevier. Full text @ Dev. Cell