
- Title
-
The role of the granuloma in expansion and dissemination of early tuberculous infection
- Authors
- Davis, J.M., and Ramakrishnan, L.
- Source
- Full text @ Cell
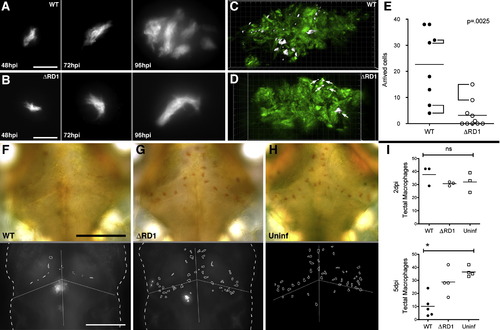
The Early Granuloma Enhances Bacterial Replication by RD1-Dependent Recruitment and Infection of New Cells (A and B) Fluorescent images of WT (A) and ΔRD1 (B) infected lesions at 48, 72, and 96 hr post-infection (hpi). Scale bars, 10 μm. (C and D) Three-dimensional reconstructions of granulomas in WT (C) and ΔRD1 (D) infection, showing Hoechst-positive nuclei rendered white (indicated by white arrows in D) accumulated over 24 hr. Scale grid, 5 μm per square. (E) Comparison of numbers of Hoechst-positive arrivals in WT and ΔRD1 lesions after 24 hr. Brackets indicate granulomas in the same embryo. Horizontal lines represent means. p value from Mann-Whitney test. (F–H) Neutral red-stained optic tectum macrophages at 5 days post-hindbrain injection with WT Mm (F), ΔRD1 Mm (G), or no infection (H). Macrophages detected using neutral red dye (upper panels) and their outlines overlayed on images of the fluorescent bacteria present (lower panels—no fluorescent image collected for uninfected embryos). Scale bars, 100 μm. (I) Numbers of optic tectum macrophages at 2 dpi and 5 dpi. p = 0.47 (2 dpi) and 0.01 (5 dpi) (Kruskal-Wallis test, p < 0.05). |
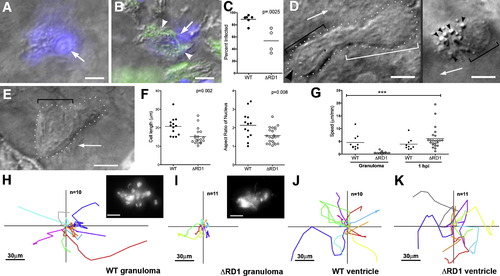
Uninfected Cells at WT Granulomas Show Distinct Morphology and Rapid Motility and Infection (A–C) Hoechst-positive nuclei (blue) are distinguishable as uninfected (A) or infected (B). White arrows, Hoechst-positive nuclei; arrowheads, bacteria (green). (C) Infected Hoechst-positive cells in WT versus ΔRD1 lesions over 24 hr. p from Mann-Whitney test. (D and E) Distinct morphologies of uninfected cells at WT (D) and ΔRD1 (E) lesions. (D) Left: highly motile cell at WT granuloma with lamellipodium (white bracket), elongated nucleus (black bracket), and uropod (large black arrowhead). Arrow indicates direction of travel. Right: distinct appearance in WT granulomas of highly vesicular macrophage shortly before phagocytosis. Small black arrowheads, vesicles. Scale bars, 5 μm. (E) Less motile cell at ΔRD1 granuloma with no lamellipodium and rounded nucleus (black bracket). Scale bar, 5 μm. (F) Comparison of overall cell length, left, and nuclear aspect ratio, right, of uninfected cells at WT and ΔRD1 granulomas. p by unpaired Student′s t test. (G) Speeds of uninfected cells at WT or ΔRD1 granulomas, or at the site of injection 1 hr post-infection in the hindbrain ventricle. Bracket above indicates results of 1 way ANOVA (Kruskal-Wallis test)—uninfected cells at ΔRD1 granulomas (***) differed significantly from all others (p < 0.005), other differences not significant. (H–K) Tracks of uninfected cells in (G). (H and I) Cells at WT and ΔRD1 granulomas—all cells tracked for each strain from one granuloma. Insets, fluorescence view of whole granuloma. Inset scale bar, 30 μm. (J and K) Cells at 1 hr post-injection. 1 hpi tracks from two WT-infected embryos and three ΔRD1-infected embryos. All scale bars = 5 μm unless noted otherwise. |

Death and Phagocytosis of Infected Macrophages (A–C) DIC time lapse of death and phagocytosis of infected macrophage. (A) two focal planes at time zero showing bacteria in cell with healthy nucleus (large black arrow), with uninfected cell (small white arrow and brackets as in Figure 2D) passing by. Dashed arrow, direction of travel. (B) Same infected cell as in (A), before (top) and after (bottom) nuclear collapse. (C) Same cell after further nuclear collapse into apoptotic sphere and later time points showing complete phagocytosis by new macrophage (black and white brackets and white arrow). Small black arrowheads, vesicles in approaching macrophage. (D) Hoechst (white) and bacterial GFP (green) overlay above, with matching DIC below, showing compact Hoechst-positive apoptotic nuclei (black arrows) associated with bacteria (white arrowheads), compared to diffuse Hoechst staining of live nuclei (white arrow). (E) Infected Hoechst-positive apoptotic cells per granuloma in WT and ΔRD1 lesions over 24 hr. p from Mann-Whitney test. (F–I) Apoptotic cells in WT granulomas detected by acridine orange (F and H) or annexin V (G and I). (F) Granuloma of red fluorescent Mm with acridine orange-positive cells (white arrows). Bracket indicates area shown in (H). (G) Granuloma of red fluorescent Mm with annexin V-positive cells (white arrows). Bracket indicates area shown in (I). (H) Acridine orange signal (left) corresponds with DIC appearance of apoptotic bodies (dotted circle, middle). Overlay, right. Scale bar, 10 μm. (I) Annexin V signal (left) corresponds with DIC appearance of apoptotic bodies (dotted circle, middle). Overlay, right. Scale bar, 10 μm. (J) DIC time-lapse images of single macrophage (nucleus indicated by white arrow) pulling a small group of bacteria (white arrowheads) from a larger cluster (X). Below, sketches derived from these panels with additional details from other planes at same time point. All scale bars, 5 μm. |
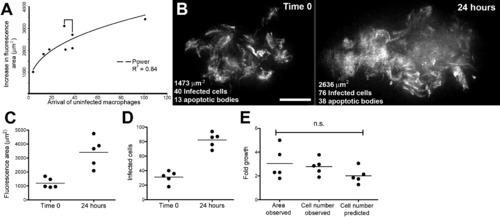
Bacterial Expansion in Early Granulomas as a Function of Macrophage Arrival, Infection, Death, and Rephagocytosis (A) Correlation of bacterial growth in granulomas, measured by fluorescence area with arrival of new macrophages. Data from eight granulomas in seven embryos. Bracket indicates pair of granulomas imaged in the same embryo. (B) Deconvolved fluorescence images of granuloma at time 0 (left) and 24 hr (right). Scale bar, 20 μm. (C and D) Bacterial expansion in five granulomas over 24 hr as measured by (C) fluorescence area and (D) number of infected cells. (E) Fold growth as measured in panels (C) and (D) as compared to predicted fold growth based on mathematical modeling. Differences not significant (ANOVA). |

Motility and Departure of Infected Granuloma Macrophages (A) Average speeds of infected and uninfected cells versus their bacterial volumes. (B) Tracks of departing infected macrophages from Movie S11. Scale bar, 50 μm. (C) Bacterial volumes and average speeds of departing macrophages in (B), compared to those that did not depart. p by Student's t test. (D–F) Departure of infected macrophages from brain granuloma. (D) Granuloma immediately after photoactivation (red) and (E) 24 hr later, demonstrating granuloma growth and departure of infected macrophages (arrowheads). (F) DIC/red fluorescence overlay of departing macrophages (arrowheads). Dotted line represents granuloma edge. Scale bars in (D)-(F), 20 μm. (G–I) Hematogenous dissemination from tail granuloma. (G) A single granuloma (arrow) photoactivated at 3 dpi. Scale bar, 300 μm. (H) At 4 dpi, photoactivated bacteria (arrowheads) seen in gill vasculature. (I) DIC image of cluster #2 from (H). Dashed line: limits of vasculature, e: erythrocyte, m: muscle. Scale bar, 10 μm. |
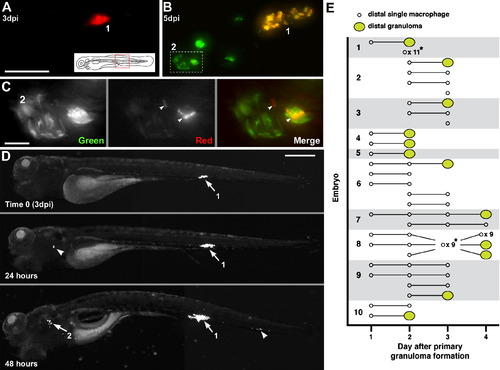
Departing Bacteria form Secondary Granulomas (A–C) Bacteria from one granuloma spread to another. (A) Primary granuloma immediately after photoactivation at 3 dpi. Scale bar, 50 μm. (B) At 5 dpi, the original granuloma (1) persists and a new one (2) has appeared nearby. Dashed box, area shown in panel C. (C) Photoactivated bacteria from granuloma 1 spreading in granuloma 2. Scale bar, 10 μm. (D) Single granuloma at 3 dpi (white arrow, 1) with departure of bacteria to new location 24 hr later (white arrowhead). By 48 hr, the original granuloma (1) continues to grow, the new locus is forming a granuloma (2), and a third locus of infection has appeared (arrowhead). Scale bar, 300 μm. (E) Dissemination from single primary granulomas in ten embryos. Horizontal lines indicate fate of departing macrophages (remain single or form granuloma) on successive days. *Indicates dissemination of multiple macrophages that could not be tracked definitively between days or that appeared on the last day of tracking. The embryo from (D) is shown as 1. |

Overall progression of infection after hindbrain ventricle injection of 50-100 CFU of WT (left) or ΔRD1 (right) Mm. Though the burden of bacteria at 2dpi appears similar, the advent of a granuloma (arrows) in WT by 4dpi results in dramatically greater bacterial numbers by 6dpi. All bacteria present in these animals were only found in the head (data not shown), thus granuloma formation does not proceed from recruitment of infected cells. Scale bar, 200μm. |

Experiment to enumerate and characterize macrophages newly arrived to a granuloma within 24 hours. (A) Outline of injections. Bacteria are injected into the hindbrain ventricle at 30 hours post fertilization (hpf). In order to form infected lesions large enough to compare with WT bacteria, ∼5x the dose of ΔRD1 was used (50-100 in WT vs 250-500 in ΔRD1). Nascent brain granulomas usually appear two to three days post infection (dpi). At this point embryos with nascent granulomas are injected via tail vein with Hoechst 33342 nuclear dye, which stains the nuclei of cells in the blood and many tissues, but not the brain (data not shown). (B-C) Outline of counting and analysis. (B) At 24 hours after the Hoechst injection, the granulomas are imaged to quantitate the number of cells recruited. See Figure 1C-E. (C) To study the fates of arrived macrophages, a second set of granulomas was analyzed. Embryos were injected as before, but a subset of granulomas with no significant difference in arrival number were analyzed. (WT: 39.3+/- 13.6, ΔRD1: 30.0 +/- 12.99, p=0.312). (Analysis of this subset or of all granulomas yielded the same results). 3D DIC timelapse was used in addition to widefield fluorescence to allow positive identification of infected state. See Figure 2A-C. Collapsed nuclei have a distinct fluorescent appearance, but were cross-checked with DIC footage as well. See Figure 3D-E. |

M. marinum expressing Kaede photoactivatable protein to mark and track infected macrophages in vivo. (A-B) Merged image of photoactivated (red) and non-photoactivated (green) bacteria in medium immediately before (A) and after (B) photoactivation. (C) Same bacteria still detectable four days later. (D) Single macrophage containing photoactivated M. marinum (red channel only) in yolk circulation valley of embryo, immediately after photoactivation. (E) The same bacteria detected 24 hours later in caudal vein. Insets show location in embryo. |
Reprinted from Cell, 136(1), Davis, J.M., and Ramakrishnan, L., The role of the granuloma in expansion and dissemination of early tuberculous infection, 37-49, Copyright (2009) with permission from Elsevier. Full text @ Cell